


Renko charts - trading without time pressure

Renko charts, i.e. trading based only on volatility
Every trader at the beginning (and not only) of his career struggling with several dilemmas. These include basic issues regarding analysis methods, instrument selection, profit and risk assumptions, and many other individual trading factors. One of the most interesting topics are the tools we use and the graph. On the portal you will find a considerable dose of information on this subject, however, this article will not be about it.
Analyzing many conferences, speeches of well-known and above all earning traders, in addition to inspiration, we can draw two important conclusions about success in trading. They primarily pay attention to psychology. One of the topics that constantly appears in this area is stress and time pressure in which we are to decide about opening or closing a position. There are many methods that you can more or less effectively implement in your trading, but is there such a tool, chart, indicator or oscillator that can exclude time from trading?
Be sure to read: How not to let internalize losses?
Renko charts in practice
Answering the question in the last sentence, yes. There is a chart rarely used by beginner traders that is able to eliminate time from forming bricks. We call this type of chart Renko. It is not as popular as bar or line charts and is used rather by more experienced or curious traders. Interestingly, it is a really simple to use chart that generates a lot of signals. The lack of time pressure results from the fact that Renko relies solely on volatility.
Renko charts are available on the platform cTrader and JForex Dukascopy in standard. For MetaTrader 4/5 platforms, you must equip yourself with custom solutions.
The Renko chart consists of the so-called boxes. In classic candle charts as the name says we have the world. Wicks, high and low prices as well as the price of closing and opening the candle form (or not). One candle depending on the settings of the chart can be formed in an hour, four hours, minutes, day, half hour, etc., depending on the interval. Thanks to this we can read many signals coming from candle formations. Instead of a candle, the Renko chart has a box that looks like a brick.
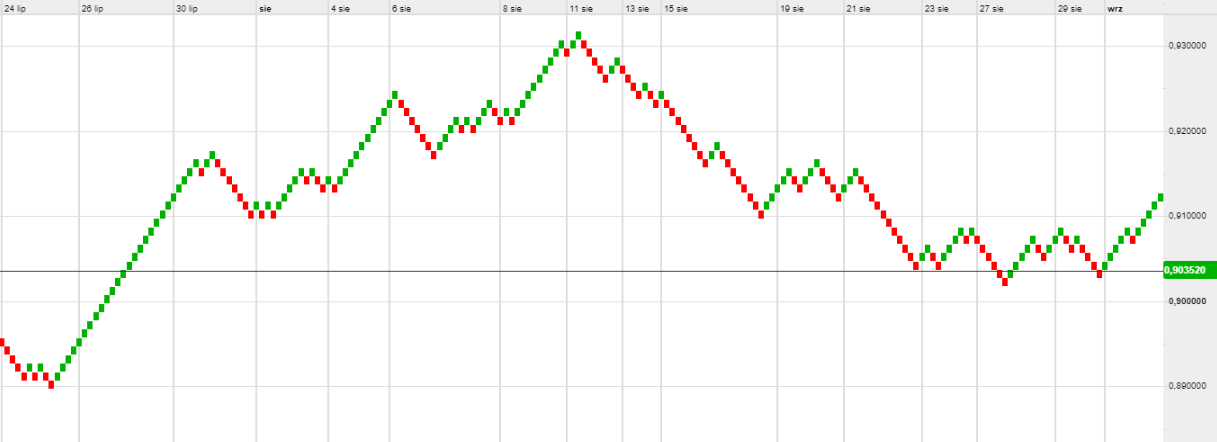
Example of Renko chart.
Variation parameter
This brick is formed on the basis of variability, and time does not matter. These boxes are designed in such a way that they are never next to each other. The only parameter that we can use to personalize such a chart is the range of variability of such a brick. Consider, for example, the shares of the company X. Its securities are listed in PLN. If we set our box to overcome the level of e.g. 5 PLN, then when the price of the stock goes up by 20 PLN we will create 4 bricks. Time does not matter. Only generated traffic and its size count.
Renko charts and consolidation
We know very well that the consolidation period is a time of low volatility, and thus small, potential profits. Considering our example above, if the price of a given company (a brick is formed after a move of at least PLN 5) will constantly move below the box range, no new one will be created.
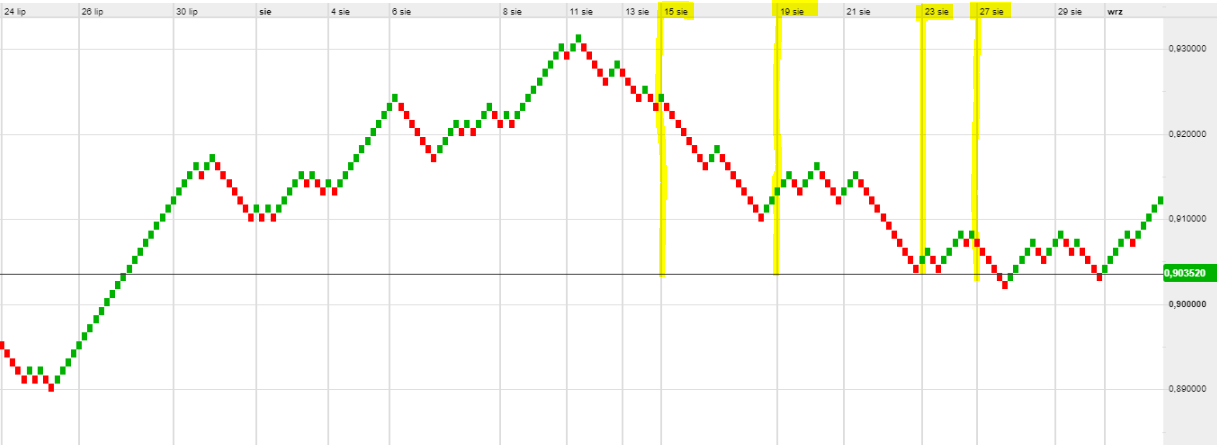
Renko charts and the consolidation period.
By using the Renko type chart, we get rid of not only the time parameter (range marked on the chart above), but also skip periods of so-called market hype. The time scale is not constant here, which means that the number of bricks does not depend on the period traveled. Let's look at the example above in the graph, where the number of boxes on 15-19 August is definitely higher than during the period 23-27 August.
What about indicators?
Why can't you add classic indicators to a Renko chart? The answer is basically simple. Most of them contain a factor of time. A large number of traders using boxes instead of classic candle charts is based on analyzing a clean chart. Thanks to the brick's capabilities and setting the size of its creation, traders filter out small movements, thanks to which the analyzed instrument clearly shows the trend.
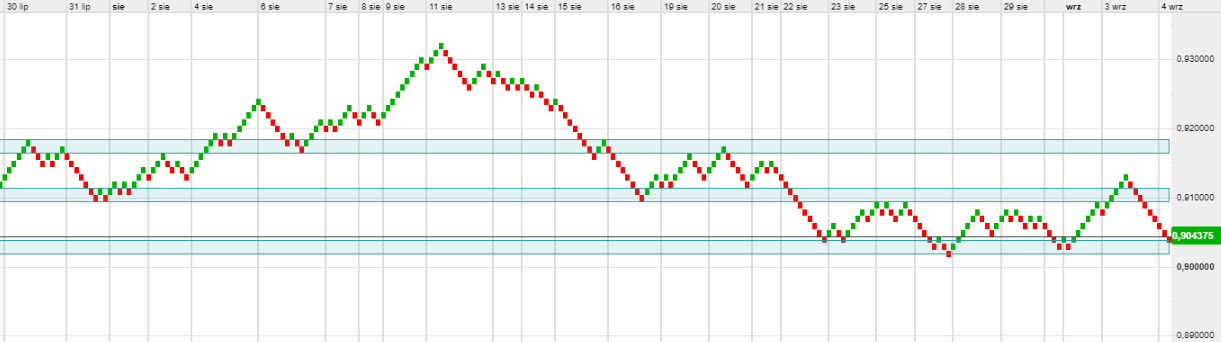
A good idea to support Renko is to use price action, or classic methods of technical analysis, without using indicators. These will be the abovementioned levels of support and resistance, trends or price channels. Often this type of chart is used for scalping.
Renko Charts - Pros and Cons
An undoubted plus of the Renko chart is the elimination of time pressure. In addition, we can individually set such parameters of variability that interest us most. The chart is simple to analyze and filters out market noise. It is easy to read the trend from them. For some, this will be an advantage for others, but the boxes are based solely on closing prices. Candles forming on candles are ignored, and the box itself does not give much information about what happened during its creation. It will be much harder to read market sentiment from it. The use of closing prices will actually reduce market "noise", but without using additional analysis, it can generate an incorrect signal. To a large extent, everything depends on the strategy adopted. Just like the use of typical technical analysis indicators.
A clean chart and the price it creates on one side can be a huge advantage. The downside will be at traders who like to slightly in advance and help to analyze input and output signals using additional oscillators. Therefore, before using Renko, it is worth not only to choose the right strategy, but also to consider whether this type of chart will be well understood by us and convenient in everyday trading.


