


Key types of support and resistance - part I

Support and resistance are the foundation of technical analysis, thanks to which we can more easily understand market phenomena. Especially for investors for whom the main methodology for analyzing charts is price action, these levels can help you plan the placement of orders such as stop loss or take profit. Skillfully outlining support and resistance, we can also learn a lot about future price movements, in other words, we are more likely to predict what the future direction will be. Of course, this topic has already been raised many times and every trader has encountered these issues, but in this guide I would like to outline the key types of support and resistance that can realistically be used in everyday trading. We will not once again discuss how to draw and set these levels, we will focus on their use.
Swing candles as support and resistance
Paradoxically, the most important support and resistance may consist of traditional up and down swings. We can usually find these levels by moving the chart to a higher interval in relation to the one we usually trade on. Just like a kind of "zooming out" the price and the market, we can often see interesting turning points. The key is to identify places where the price can turn up or down. These levels do not always have to be determined with the accuracy of the pip, they can even cut the pillars of individual candles or may constitute zones rather than exact levels.
Let's look at the AUDUSD chart. An interesting resistance zone could be determined at the weekly interval.
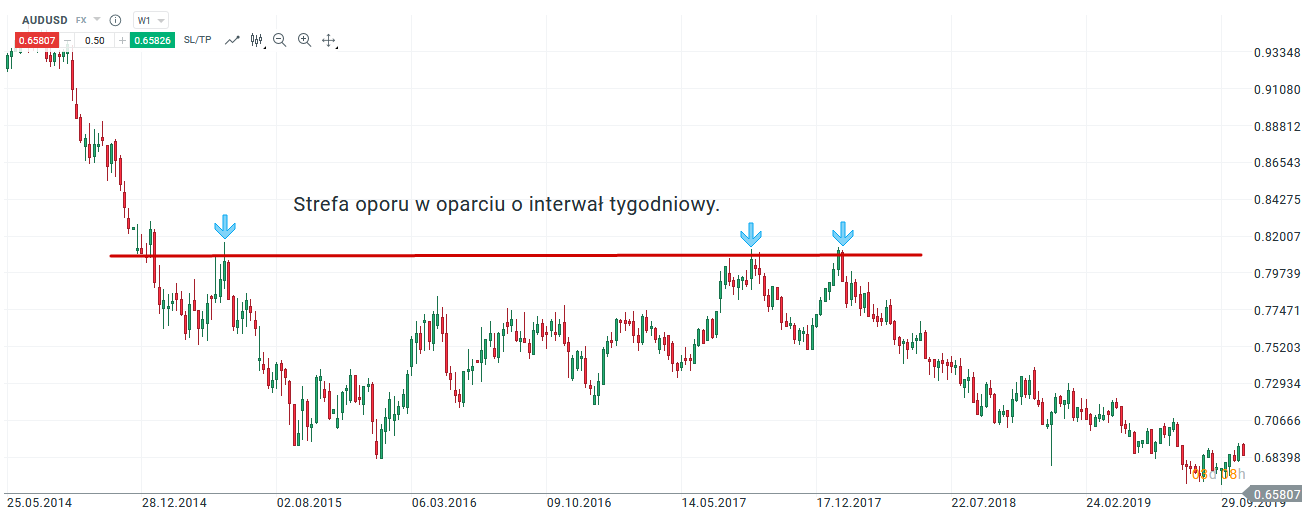
AUD / USD chart, W1 interval. Source: xNUMX XTB xStation
In the second chart we have exactly the same area, but in terms of day. We see that the price respected the zone several times.
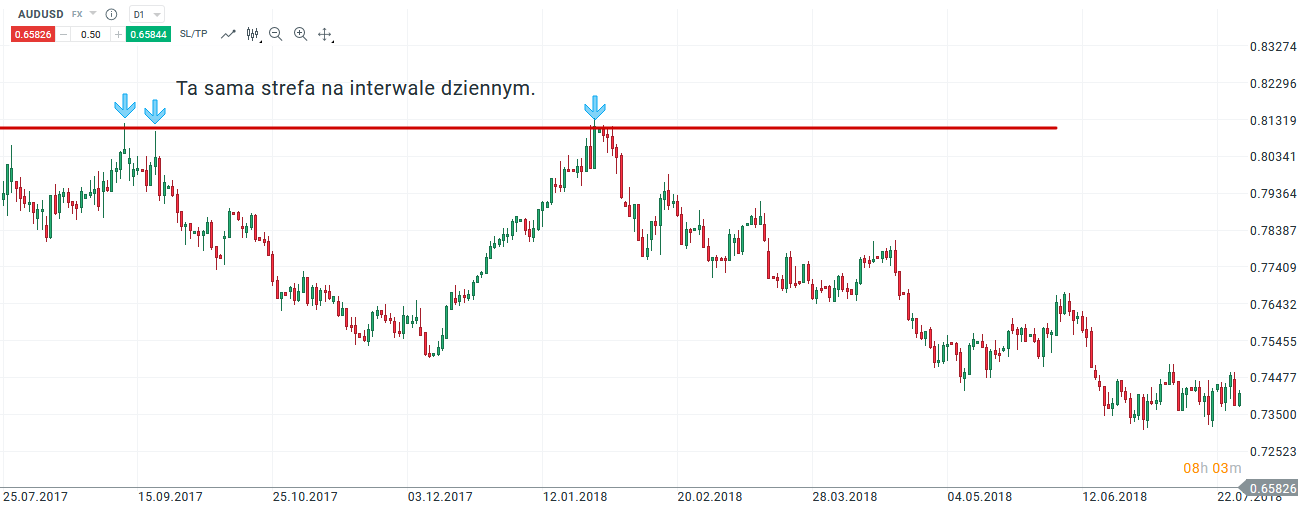
AUD / USD chart, D1 interval. Source: xNUMX XTB xStation
The principle of changing poles
You can also often find the statement:
"Preinforced support becomes resistance, pierced resistance becomes support. "
This is nothing else the classic principle of changing poles. By using swings as support and resistance we can also mean these "Gradual" levels that are forming and when the market breaks them, look for opportunities to take a position after withdrawals. In this way we can reflect a certain market trend - if we deal with such price behavior we know that there is a strong trend. This rule may seem trivial, but it works in everyday trading.
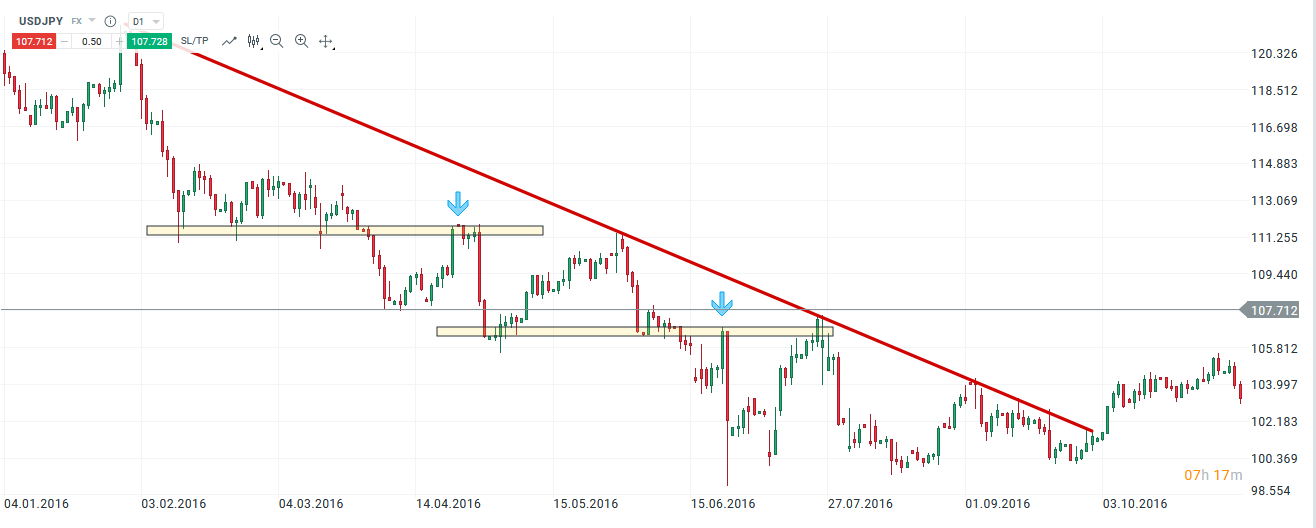
The principle of changing poles. USD / JPY chart, D1 interval. Source: xNUMX XTB xStation
We can also use swings to set turning points, even if the price on a given instrument is not in the trend. Markets spend as much time consolidating or moving in different areas. If we are dealing with lateral movement, we can also try to determine the next place to conclude a transaction based on the last swing. The current situation at USDCHF is a good example. We see that for a few dozen days, the couple is moving in range and there are no signs that would speak for one of the parties. What you can see, however, is the strong downward swing (marked on the chart). Since then, demand, even though it has tried to break through this barrier many times, finally failed to keep the price above. Considering this swing and establishing a resistance zone on its basis, it was possible to play the short position quite several times.
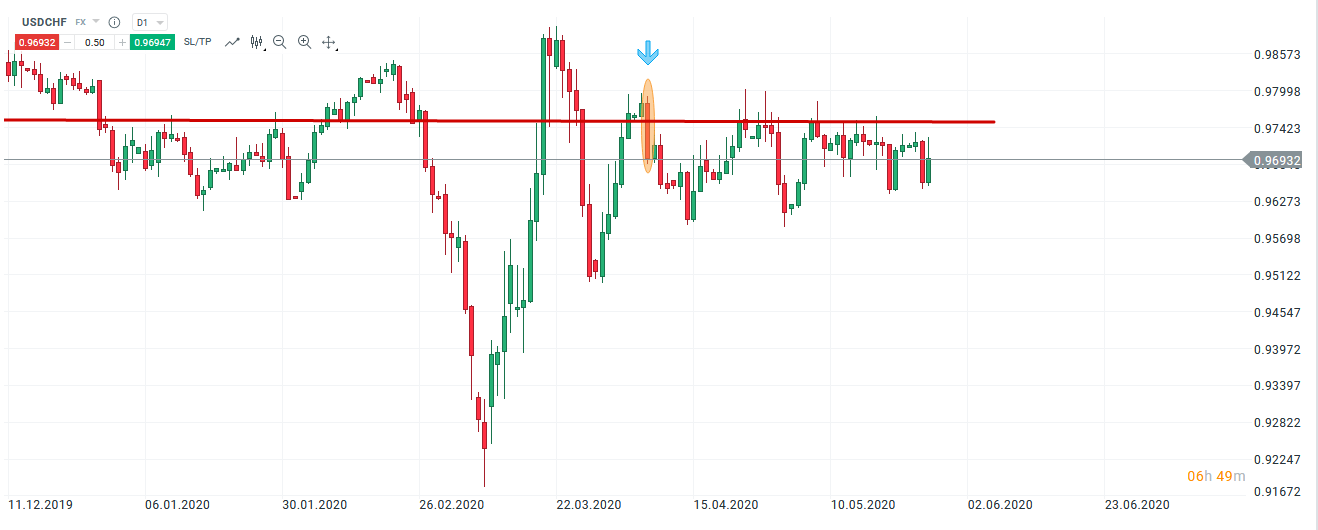
The use of a swing candle in consolidation. USD / CHF chart, D1 interval. Source: xNUMX XTB xStation
In the next part we will discuss dynamic support and resistance as well as those based on Fibonacci lifting.


