


Avoiding wrong signals - how to combine technical analysis indicators with each other

Opinions regarding the use of various types of technical indicators available on trading platforms, no doubt, are divided. There will be many investors who point out the indicators with a wide arc, say "no" and for whom they only distort the image of the market. On the other hand, there will be as many supporters for whom the indicators will be helpful and which they use every day in their investments. If you are just starting your adventure with trading and it seems to you that the rates can help you achieve repeatable profits in the market, or you belong to the second group, it is worth paying attention to a few tips to help you choose them.
Be sure to read: Signal Filtering - How to choose the right opportunity to enter a position
General characteristics / redundancy of indicators
At the outset, it is worth noting that the indicators can be broadly divided into three main groups:
- volatility indicators,
- trend indicators,
- momentum indicators.
It is very important for a trader to have specific knowledge, which category a given indicator belongs to, and how to combine the best for each of them, corresponding to a given style of trade. Such knowledge can significantly help in making decisions on the market. In turn, combining indicators in the wrong way very often leads to unnecessary confusion, lack of readability of the chart and disturbances in price interpretation.
What is the proverbial redundancy? In the simplest terms, it is nothing more than using different indicators, but belonging to the same group, showing the same information on the chart.
MACD and RSI on the first fire. Both of the most popular, both can be included in the momentum group. In the graph we can observe that during the trend movement, both indicators behave in exactly the same way. They refer to the price dynamics, both RSI and MACD, while they are falling, giving the investor exactly the same information.
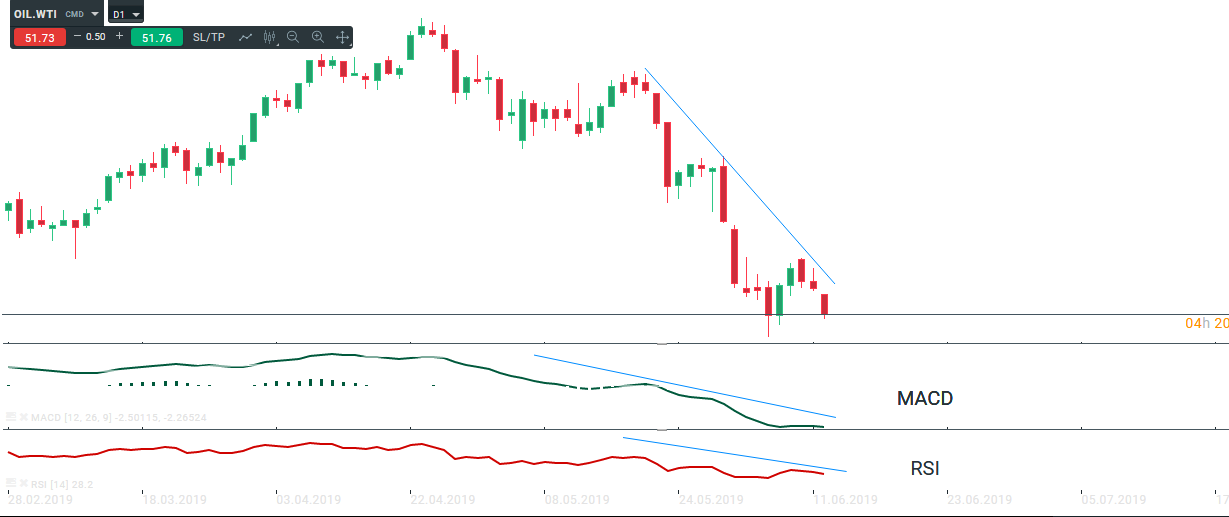
An example of using indicators from the same group, Oil WTI. Source: xNUMX XTB xStation
The problem with the excessive number of indicators refers mainly to choosing one indicators group. This results in attributing excessive attention to information from specific indicators, while omitting many important things that can be seen on the chart. Very often in the case of strong trends, using many indicators, we may have the wrong belief that the trend is stronger than in reality, because all give us the proverbial green light and the same information.
The most important categories / classes
The table below presents the breakdown of the most commonly used indicators, divided into relevant groups. Knowing the category of a given indicator, it is not enough to avoid using only those from the same group, in addition you can combine indicators from different categories that will complement each other.
|
TREND |
MOMENTUM |
VARIABILITY |
|
ADX |
RSI |
ATR |
|
MACD |
CCI |
STANDARD DEVIATION |
|
PARABOLIC SAR |
WILLIAMS |
KELTNER CHANNELS |
|
BOLLINGER ROLLERS |
Stochastic |
|
|
MEDIUM CROSSING |
MACD |
|
|
ICHIMOKU |
Combining indicators in practice
The most important thing to remember is the fact that the perfect combination of indicators is not a combination that points the same direction but one that shows information that is mutually complementary.
For example, the combination of RSI and Bollinger bands is interesting. The first indicator provides the necessary information about momentum: low and falling RSI indicates an increasing momentum, the level of the indicator near 50, shows signs of lack / weakening momentum, while the growing high RIS is strong growth momentum. The ribbons, in turn, can show a lot of interesting information about trends. The price between the outer and middle ribbon shows the phase of the trend. If the middle web breaks, it may be a sign of potential reversal. Another sign may be the lack of a price to the outer band, which may indicate that the trend is extinguishing.
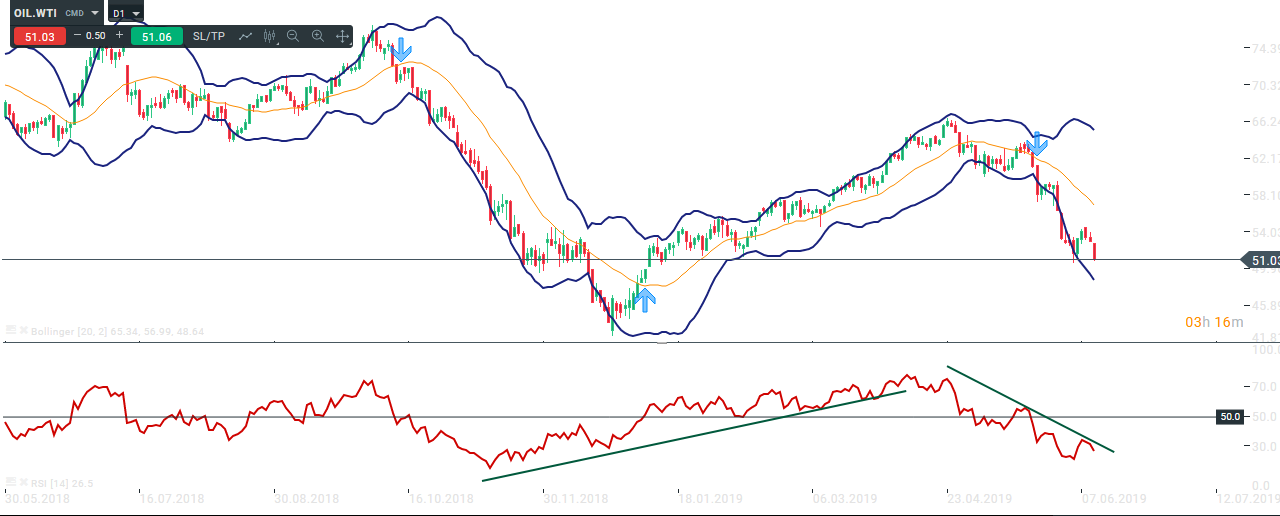
Combining the example indicators, Oil WTI. Source: xNUMX XTB xStation
The presented example is just one of many. Remember that knowing what index to use and under what circumstances is an important aspect of the trading plan. The use of appropriate indicators, and combining information from them with the analysis of the chart, can have a positive impact on your trading.


Leave a Response