


Volume Spread Analysis (VSA) – analysis of volume and price movements
 – analysis of volume and price movements")
Volume Spread Analysis (VSA) is a trading technique developed by Tom Williams that combines trading volume analysis with price movement analysis. The purpose of VSA is to identify and interpret the dynamics of demand and supply on the market, which is crucial for the effective use of economic and macroeconomic events in the process of making investment decisions.
Basic assumptions of the methodology
In trading, understanding supply and demand is extremely important. Demand, or the amount of a financial instrument that investors want to buy, and supply, or the amount of an instrument that investors want to sell, are the two key factors that influence the price. If demand exceeds supply, prices go up. If supply exceeds demand, prices fall.
The VSA ignores the causes of these two forces in the market and focuses on their very presence. Thanks to this, during key events and macroeconomic data we are able to determine the dominant party regardless of the nature of the information.
Volume Spread Analysis: Case Study
For example, May 16.05.2023, 14. at 30:XNUMX the publication of macroeconomic data on retail sales in the USA took place.
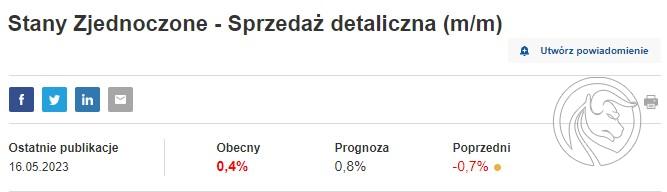
Reading of macroeconomic data from May 16.05.2023, XNUMX, source: investing.com
The value of the retail sales index was below investors' expectations, which should weaken the dollar. The futures contract chart below Eurodollar shows the timing of the information and the reaction of price and volume.
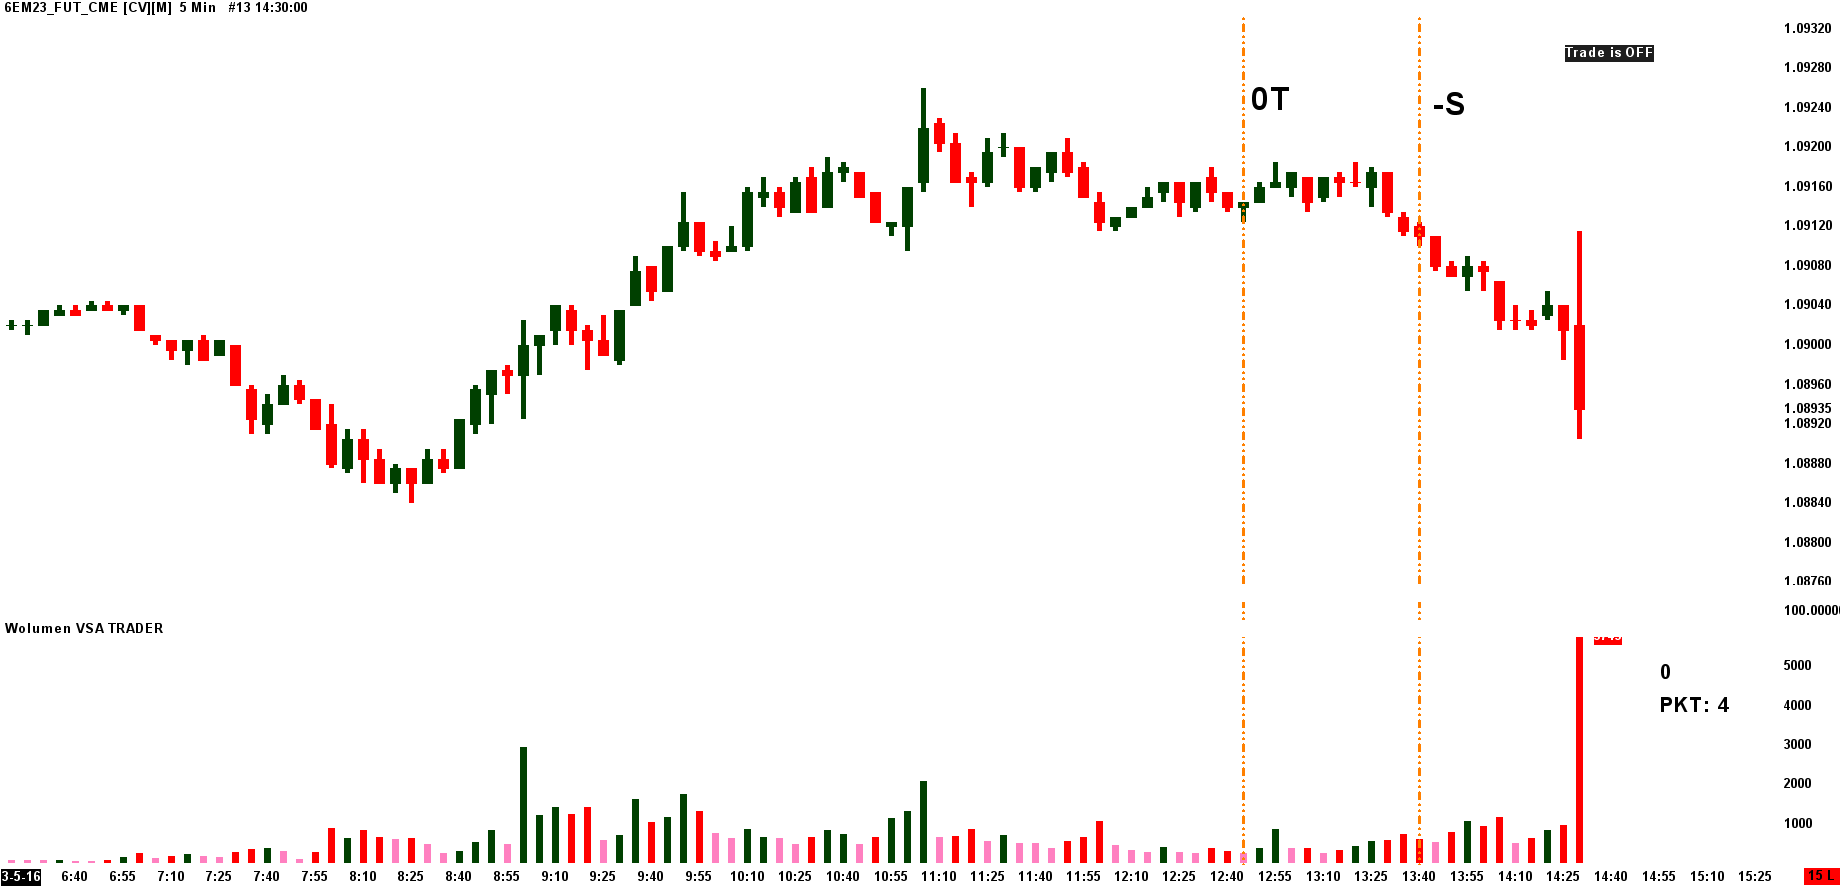
EURUSD futures 5-minute chart. 14:30 May 16.05.2023, XNUMX
As it is a futures contract on EURUSD, negative data from the US market should increase this asset. The VSA analysis, on the other hand, clearly indicates the dominance of the supply side. The candle from 14:30 is in the VSA nomenclature a Trap Up Move signal with a strong supply meaning. The supply nature of this asset was already visible in the earlier moments of the session, therefore, together with our traders, we were looking for short positions even before providing the data (symbol S visible on the chart means the direction "short" appointed by the supervisor), and an additional signal only confirmed the dominance of supply on that day. The chart below shows the EURUSD quotes on the mt4 platform after the release of the data.
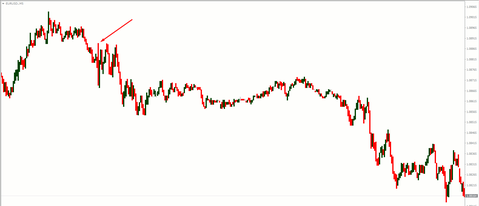
EURUSD chart (5 minutes) after data release. Source: MT4
The law of supply and demand is a universal law governing financial markets, including the stock market. While on the futures market we trade in low time scales, i.e. a 1-minute, 5-minute chart, observing a maximum of a few values, in the case of the stock market we use a different approach resulting from, among others, from the liquidity and volatility of this group of assets.
In order to make optimal use of the stock market, we are looking for companies with significant VSA signals indicating increased demand or supply activity. New technologies, i.e. artificial intelligence algorithms, made it possible to automate this process, which allowed for the ongoing scanning of thousands of companies and the determination of those that are an interesting situation in the context of the VSA methodology. The results of the scanner's operation can be observed on the website at the moment vsa-insider.us.
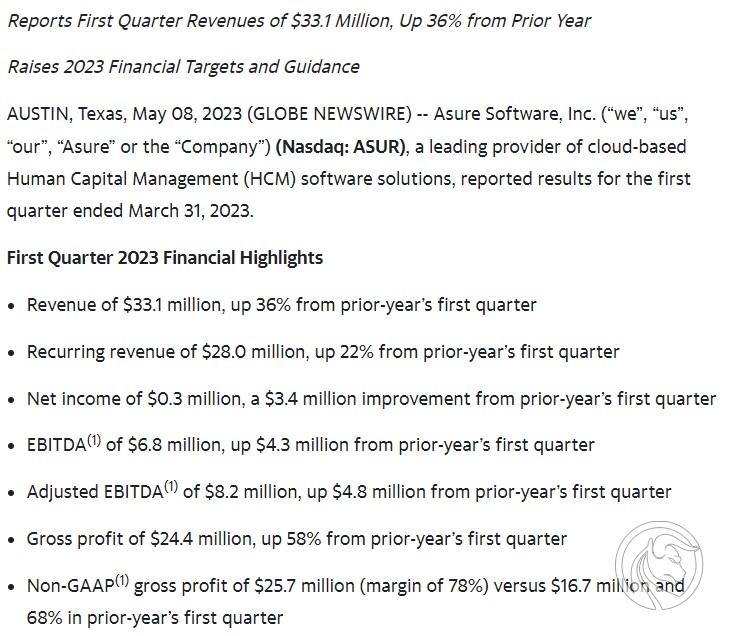
For example, on May 10.05.2023, 14. at 27:15 (session starts at 30:XNUMX) Polish time, the scanner detected a supply signal on the ASUR company listed on the stock exchange NASDAQ.
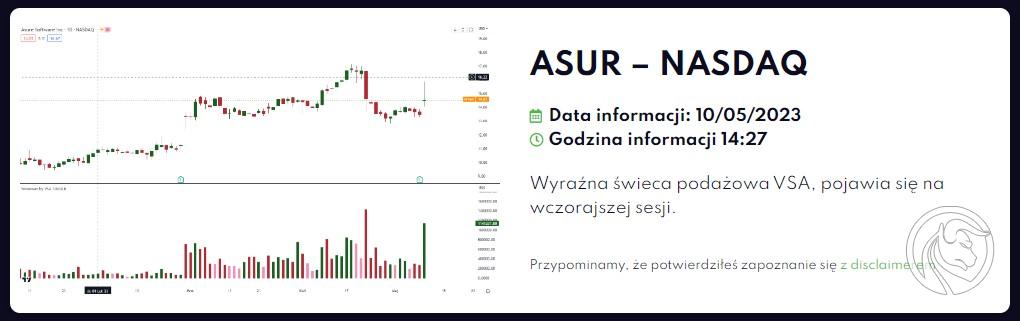
Indication of the VSA-INSIDER scanner of May 10.05.2023, XNUMX.
May 08.05.2023, 38.89 The company published its quarterly financial results. The report shows an increase in earnings of 0.01%. A quarter ago, the company was expected to report earnings of $0.17 per share, but in fact it generated earnings of $1,600, or XNUMX% of expected value.
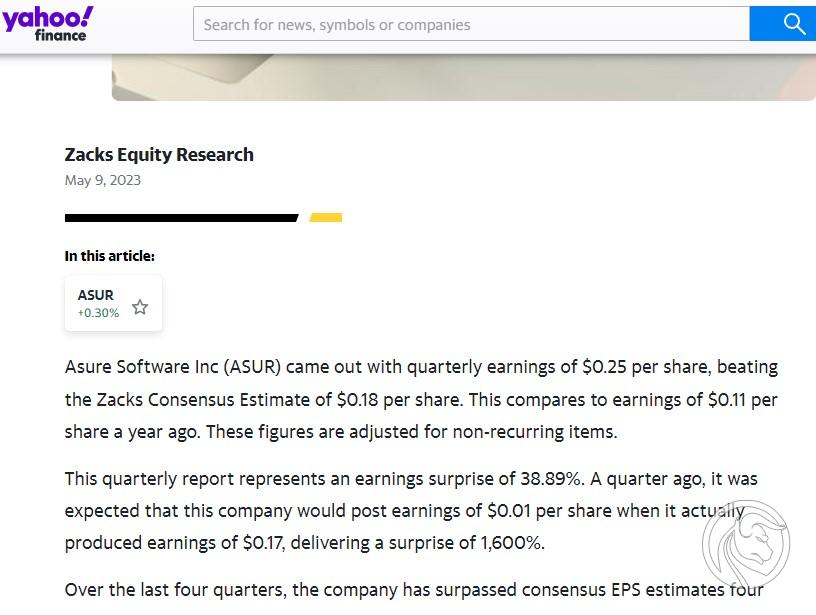
Source: finance.yahoo.com
Source: finance.yahoo.com
Such good data is often a clear signal to investors that the company's price should go up. Let's look at what the chart of this company looked like on the day the signal was published in vsa-insider.us.
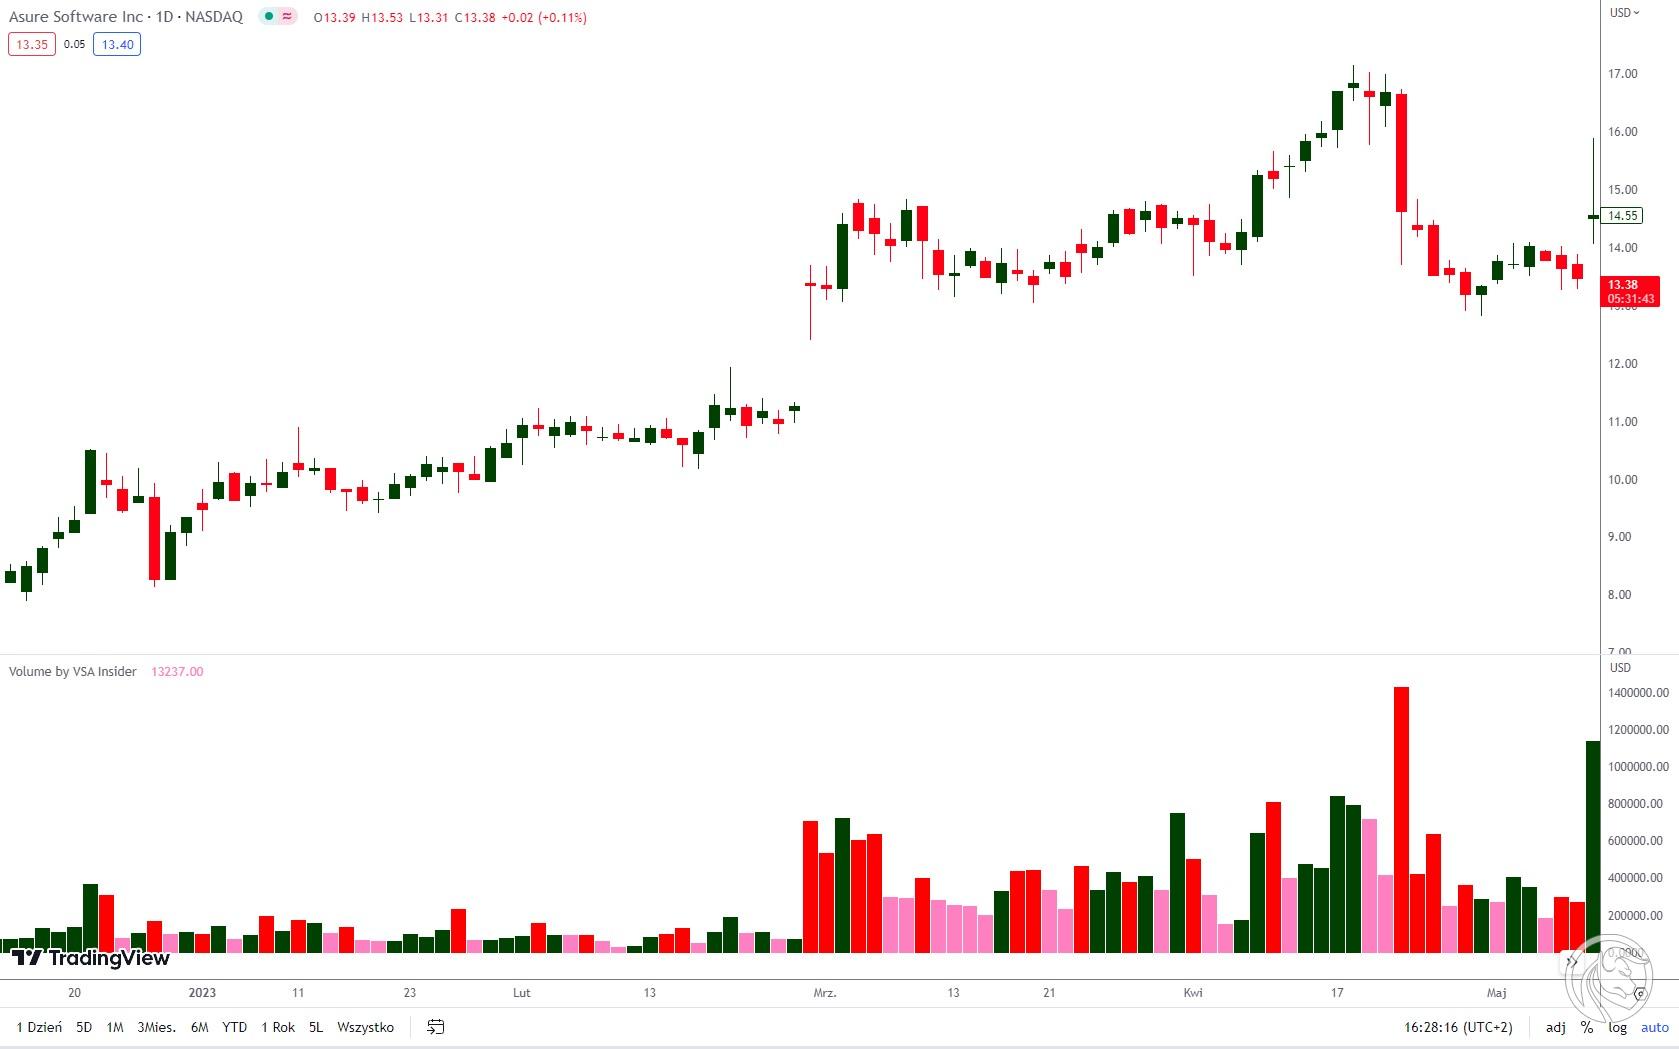
Chart of the ASUR company on May 09.05.2023, XNUMX.
After the publication of the data, a supply VSA signal appeared on the chart. Low closing and high volume indicate the dominance of supply. In addition, the supply was already present on this company. The chart below shows the reaction of the price to the supply signal.
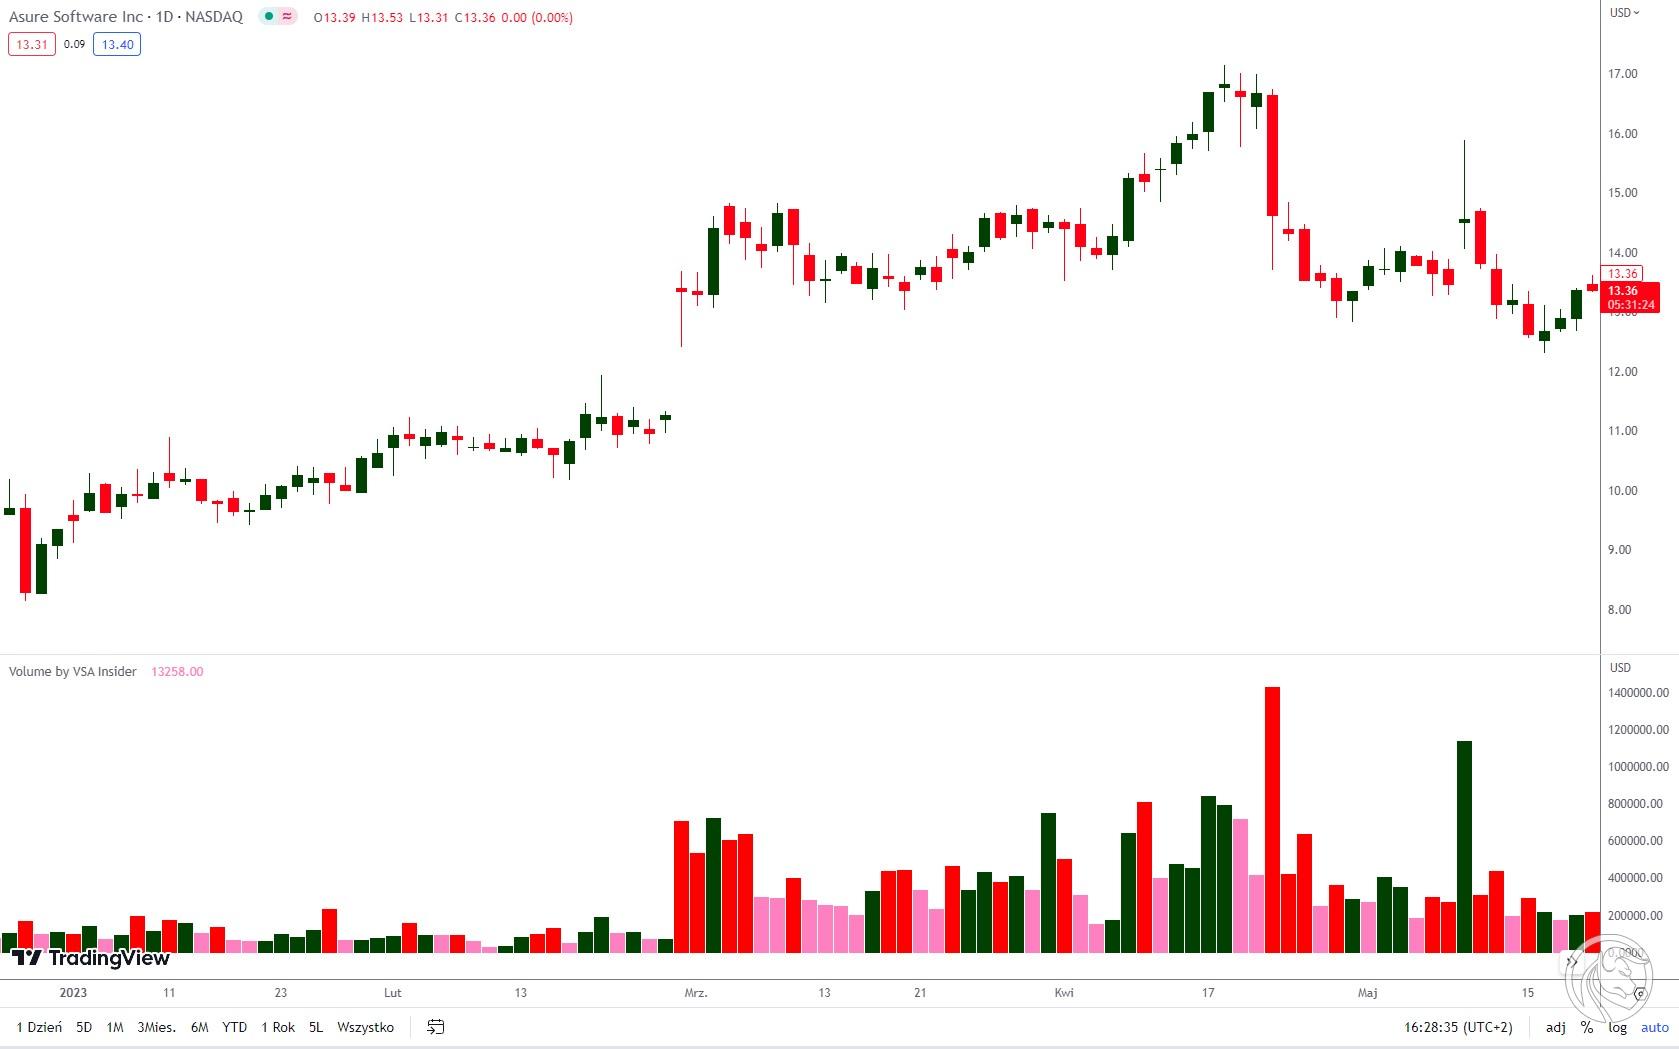
Chart of ASUR companies May 19.05.2023, XNUMX
A clear supply signal started the downward move and since closing the price has fallen by a maximum of 15,4%.
VSA summary
These examples show how important the observation of supply and demand is in the analysis. Volume, on the other hand, is a key element of the full picture of the market that allows such observation. After all, in capital markets, it is the flow of capital that should be considered first.
Want to learn more about the VSA methodology?
take part in a free webinar organized in cooperation with Forex Club and VSA Trader. Participation in the event is free.
The use of volume in the forex market in practice
May 31, 2023 at 20:00
During the meeting you will learn:
- what is the role of volume in the analysis of the distribution of demand and supply on the chart,
- where to get the volume for analysis on the forex market,
- what do schemes based on volume and price analysis look like.
You don't know where to get the volume for analysis on the Forex market? During the webinar, a specialist in the VSA Trader methodology, Rafał Glinicki, will discuss various sources of volume data that can be used for market analysis and will present the most important issues regarding Volume Spread Analysis. This will give you access to the necessary information to help you better understand the trading activity in the market.
Host of the webinar
 Rafał Glinicki – Founder and President of the Management Board of VSA TRADER Sp. z o. o. and CEO of Black Wolves Corporation. Trader, expert in Volume Spread Analysis (VSA) methodology and practical approach to trading. He has experience supported by over twenty years of practice in trading, he is a two-time winner of the top ten of the "World Top Investor" competition, in which traders from around the world take part.


 – analysis of volume and price movements")
 – analysis of volume and price movements")


