


Price Action strategy according to Nial Fuller

"What is Price Action? " - a question asked by many beginner traders. If we answer them that "This is a price move in time" (read: price action) or similar, they can still have a lot of doubts. Whether it's to understand the definition itself or to trade according to Price Action (PA). In this guide, we'll give you examples of charts to illustrate your strategy and the most effective ways to use it.
Price Action in practice
At the beginning of the base. In the chart below we have examples for several main terms used in descriptions Price Action strategy:
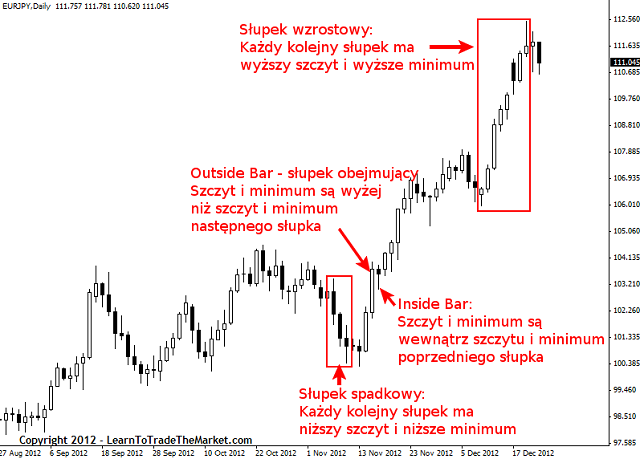
Growing pole (Up bar) or "bullish"
A bar that has a higher top and a higher minimum than the bar immediately preceding it. Growth bars marked on the chart above create an upward trend. It is generally accepted that a given bar is upward when it closes above its opening. The above example shows, however, that the black box is also marked in the box. In our case, it means that it closed below its opening. In this arrangement it should be considered that the black bar is also upward. Its top and minimum are above the top and minimum of the previous bar. This is a sign of a strong trend and then buyers (or "bulls") are still dominant.
Inheritance post (Down bar) or "bearish"
A bar that has a lower peak and a lower minimum than the bar immediately preceding it. Note that in the example above, the closures of the posts are below their openings. This is typical of sloping posts, but not always necessary. Just as it was for growth bars. Inheritance bars are a sign that sellers (or "bears") are still dominant.
Inside Bar ("Internal" or "covered")
A post sometimes referred to as a smaller range bar. Its top is lower than the top of the previous bar and its minimum is above the lowest of the previous bar. Some people stick to this definition, and if even one of the extremes of adjacent bars were equal, the peak with the peak or both minima, they no longer consider the given bar as Inside Barfor others it makes no difference. The appearance of Inside Bar usually indicates a lack of determination on the market. As with any other bar, the distance between it closed and opened shows the degree of indecision. In other words, neither party, buyer or seller has a clear dominance.
Outside Bar ("external")
Embossing post, sometimes also called "maternal" or in English Engulfing Bar, has a large range. Its top is higher than the top of the previous or next bar. On the other hand, its minimum is below the lowest value on the previous or next bar, so that it "covers" or "covers" the adjacent bar. In the example shown in the chart, the closing of the engaging bar was slightly above its opening, meaning buyers dominated.
If the opening is in the lower 1 / 3 or even 1 / 4 parts of the entire post, and the closure in its upper 1 / 3 or 1 / 4 part, then this bar is called including growth and then buyers have dominance. If the reverse and open situation is in the upper 1 / 3 or 1 / 4 part of the post, and its closing in the lower 1 / 3 or 1 / 4 parts, then such a bar is called covering inheritance. Then the sellers dominate.
Another definition of covering bar is also used, especially for candle charts. Its opening and closing must "include" the opening and closing of the previous post. Using this approach, you can find examples where a given bar is encompassing. And this despite the fact that its top and minimum do not include the extremes of the neighboring post. The first definition, presented earlier, was probably created during the observation of bar charts in which it is more difficult to notice closings and openings.
What can be considered a signal?
When markets are in motion, they leave traces or "prints." These are the tracks Price Action, the price movements visible on the chart, and sometimes thanks to them we can get a hint as to where the market will go in the next steps. These are signals, systems or sets of Price Action, or simply Price Action strategies.
For us, the key is to find such a price signal Acion, which can be considered as "confirmation entering the market by concluding a new transaction. In a moment we will find out how to combine Price Action price movement with certain market relationships. We will also show you how to match this with the matching confirming signals to find entries with a high probability of success. For now, however, let's focus on the PA itself and the moment of entering the transaction on its terms.
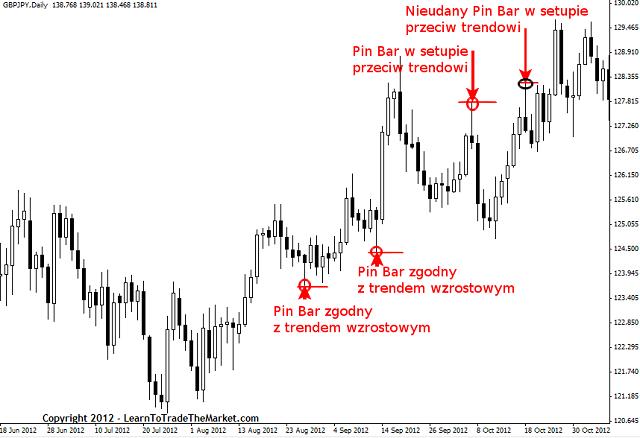
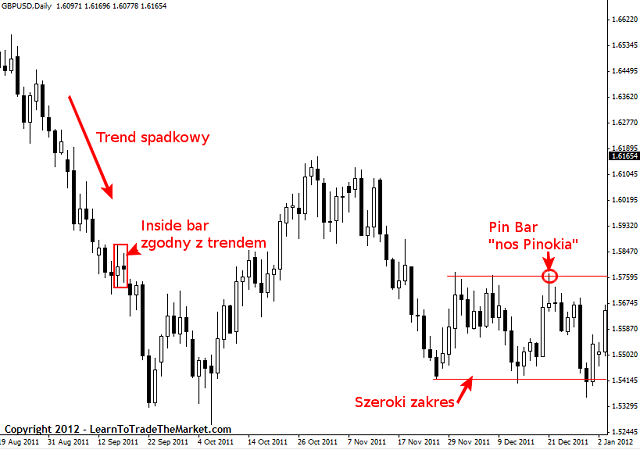
The chart below shows examples of one of my favorite Price Action strategies. It is setup from "Pin bar for reversals" (Pin Bar is a "Pinocchio nose", a candle with a long wick and a small body in the lower or upper part, which "cheats" and looks like the elongated nose of a lying Pinocchio. First it goes quite one way to eventually turn back and close at the opposite near the opening point, leaving a trace in the form of a long wick, which is just "Pinocchio's nose"). Note that this setup failed in one of the examples shown. But this also happens in reality, not every setup will be successful and not everyone will make a profit.
Price Action and convergence
Convergence is a specific point or arrangement on the market where two or more levels overlap, creating a significant place. The word in dictionary definition means:"Convergence or convergence". Therefore, when we are looking for converging places on the market, we mean points where at least two separate levels coincide.
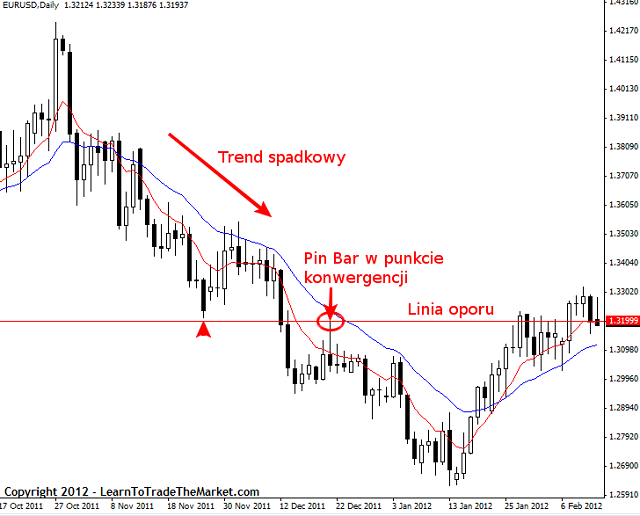
The following chart clearly shows an example of a price chart analysis based on Price Action with convergence. The point or level of convergence makes the system more important. In this example, the Pin Bar shows a reflection from the clearly visible horizontal straight line of resistance and the dynamic resistance between the 8-period and 21-period (EMA) moving average lines (red and blue lines). The downward trend is another component of convergence in this chart. If a PA setup that is in line with the trend, such as a Pin Bar, appears, then it is also a place of convergence.
So we have 3 factors that are compatible with each other and strengthen the signal to open a short position in a Pin Bar setup:
- downward trend,
- reflection from the horizontal resistance line,
- reflection from dynamic resistance.
Price Action and determining the market trend
The next chart shows alternating peaks (Swing High) and pits (Swing Low) in both growing and declining trends. The trend is downward if they are alternatingly gettinglower peaks - LH (Lower High), and getting lower wells - LL (Lower Low). The price on the chart is in an increasing trend, if it creates alternately more and more higher peaks - HH (Higher High), and ever higher wells - HL (Higher Low). If, however, the price does anything else, it is in consolidation. So it moves within a certain range, in a triangle, flag, rectangle, showing no tendency to increase or decrease.
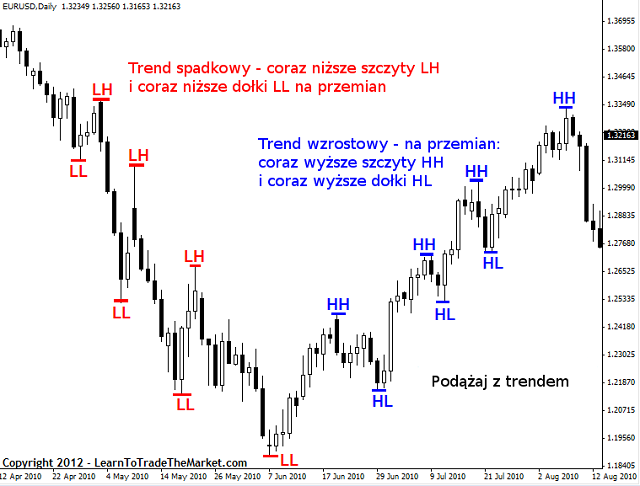
A trend is assumed to exist as long as price creates next ever higher highs and lows (uptrend) or ever lower lows and highs (downtrend). When a trend breaks, there is usually a consolidation period that can be easily seen on the chart with a shorter interval. As you gain experience, you'll be able to recognize what's happening on the chart at first glance. And this without the need to use other time frames (TF - time frame).
If the price is in the so-called narrow consolidation, this is about sideways movements. If this area of consolidation is wider, then it is a movement within a limited range (Trading Range), without a clear sequence of wells and peaks, which could signal a lasting trend. In the chart below, we have an example of narrow consolidation and Price Action on the side and a wide area, limited from the top and bottom.
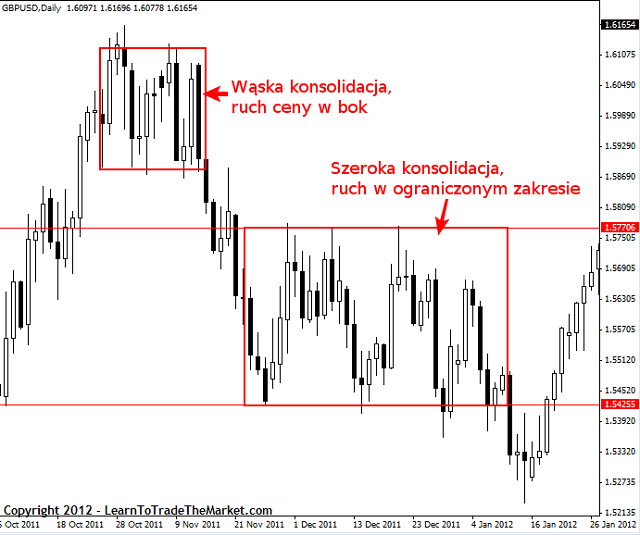
Price Action in consolidation and following the trend
"Following the trend " this is a fairly general statement, often causing a lot of trouble for beginners Forex marketwho have not yet developed their own effective strategy. My way of playing with the trend is simply to look for the appropriate Price Action setup on the daily chart (D1 interval), which will give you a favorable profit / risk ratio and preferably this setup will be in addition to in line with the trend visible on the chart, creating convergence.
Trading on a market under consolidation is recommended when the consolidation has visible and long-term ranges - limitations - on which the price has already rebounded several times. It is much better when it is a larger consolidation than a sideways price movement. A period of narrow consolidation can also be used to earn. This is when charts with a smaller interval are most helpful. However, for first time traders, it is recommended to gain experience using Price Action on a daily or four hour chart.
The chart below provides excellent examples of using the PA strategy to follow a trend and on a market in consolidation.
Summation
I hope that thanks to the guide you have gained a solid foundation that will allow you to earn the first trading trades using the Price Action strategy. At the end I would just like to remind you that your adventure with PA is best started with daily charts. What is the reason? Extremely simple:
The daily chart provides a clean - if not the cleanest - and precise view of price movements. The picture becomes more convoluted with smaller intervals. On the other hand, movements are highly random and disturbed by noise (for comparison, analyze the situation on the M5 and D1 charts).
Every building needs solid foundations. Likewise, every trader needs a valuable foundation for successful trading. For this purpose, the Price Action strategy works best on daily charts. Simple assumptions, clear patterns and a "clean" chart without unnecessary indicators, indicators and elements distorting transparency.
Author Comparic.pl


