


 are recording the largest daily outflow of funds in history")


Australian companies - an interesting idea for portfolio diversification [Guide]

The Australian capital market is one of the most important in the Asia-Pacific region. In Australia, minor stock exchanges are, among others Sydney Stock Exchange, National Stock Exchange of Australia. The largest volume of trading is concentrated on ASX, the Australian Securities Exchange. The ASX exchange offers trading in stocks, futures, options, bonds, ETFs and structured products.
Be sure to read: Australia - Economy and demography
In fiscal 2020, ASX had daily trading in shares for the last fiscal year of AUD 6 billion. Daily turnover in futures contracts was AUD 214 billion. The period of the pandemic resulted in an increase in the value of issues of shares by listed companies. In the quarter ending June, issues totaled $ 31 billion, the highest level since the last quarter of 2009. On the other hand, stock exchange debuts decreased. In the financial year 2020, the value of the IPO was US $ 27 billion. Decrease by 28% y / y. Below is a summary of the emissions from the last 5 years.
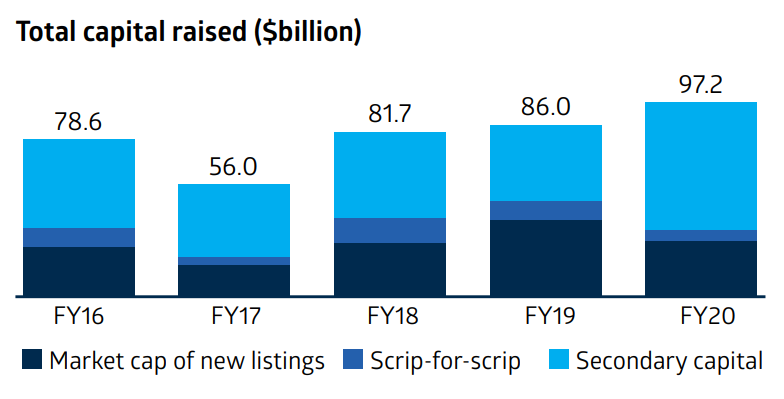
Source: ASX report for the financial year 2020
Popular indices grouping Australian stocks are S & P / ASX 100, S & P / ASX 50 and S & P / ASX 20. The main index is S & P / ASX 200.
S & P / ASX 200
Index grouping the 200 largest and most liquid Australian stocks. The index may include companies listed on the ASX. The index is calculated on the basis of floated-adjusted, i.e. the shares are free floated adjusted. According to data provided by the S&P Dow Jones Indices, the index after dividends provided an average annual return of 8,1%. At the end of November, the company's average capitalization was AUD 9,7 billion. In turn, the median was AUD 3,5 billion.
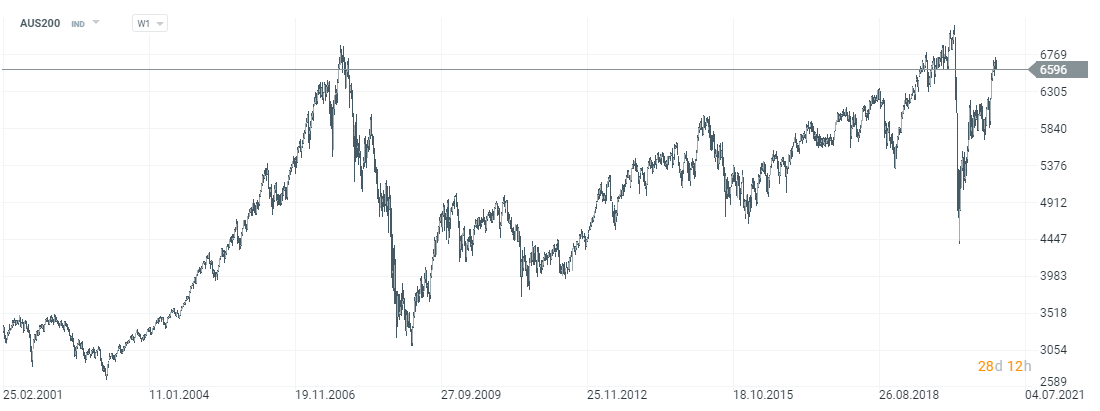
AUS200 chart (CFD on the ASX 200 index), interval W1. Source: xNUMX XTB.
Companies dominate the index classified according to GICS in the financial and raw materials sectors. Companies from both sectors account for 47,2% of the index. The index consists of 8 companies from New Zealand, 5 American companies and one company each from France and Great Britain.
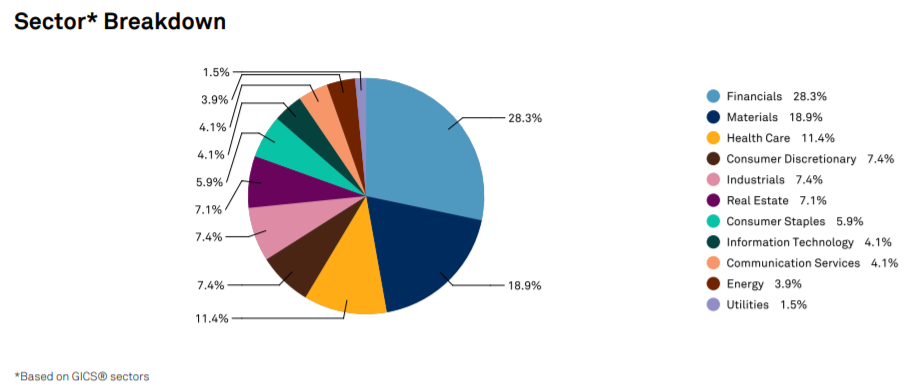
Source: S&P Dow Jones Indices
The range of companies listed on the ASX exchange is very wide. You can find gold mine owners, waste management companies, wine producers and an airport operator there. Selected companies listed on the ASX are presented below.
ASX Ltd
The company is valued at approximately AUD 14,5 billion. It is the operator of the largest stock exchange in Australia. In 2010, Singapore Exchange announced its desire to merge with ASX. The offer was rejected. According to the company's annual report, ASX is the largest organized interest rate derivatives trading venue in Asia. It is also one of the major bond markets in Asia. The company's financial year ends in June.
|
ASX Ltd. |
2017FY |
2018FY |
2019FY |
2020FY |
|
revenues |
AUD 765 million |
AUD 827 million |
AUD 871 million |
AUD 949 million |
|
Operational profit |
AUD 539 million |
AUD 584 million |
AUD 604 million |
AUD 657 million |
|
Operating margin |
70,45% |
70,6% |
69,3% |
69,2% |
|
Net profit |
AUD 434 million |
AUD 445 million |
AUD 492 million |
AUD 499 million |
carsales.com
The company is valued at approximately AUD 5 billion. The company owns websites for selling cars, motorbikes and boats. Works, among others on the Australian, Brazilian, Mexican and Chilean markets. It is also active in South Korea. The financial year ends in June.
|
carsales.com |
2017FY |
2018FY |
2019FY |
2020FY |
|
revenues |
AUD 372 million |
AUD 444 million |
AUD 417 million |
AUD 396 million |
|
Operational profit |
AUD 167 million |
AUD 187 million |
AUD 181 million |
AUD 166 million |
|
Operating margin |
44,9% |
42,1% |
43,4% |
41,9% |
|
Net profit |
AUD 109 million |
AUD 185 million |
AUD 85 million |
AUD 115 million |
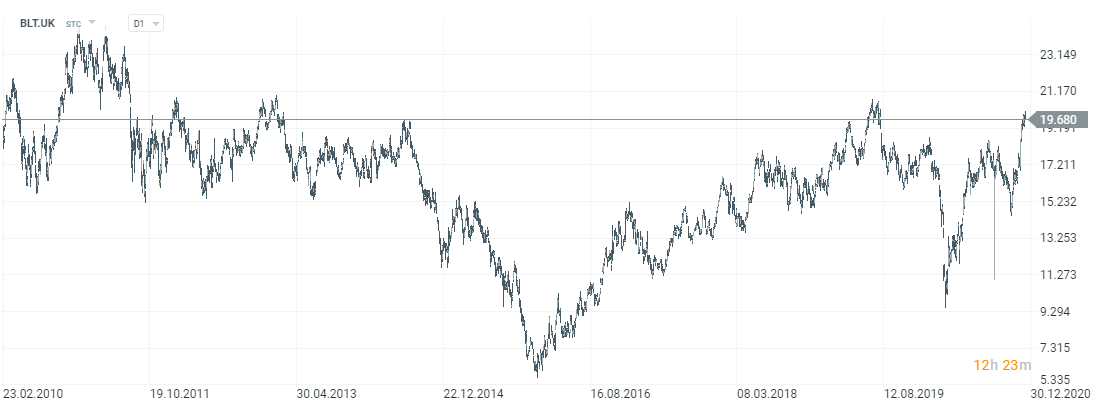
Rio Tinto Group
The company is listed on the stock exchange in the USA, Australia and Great Britain. It is one of the largest raw material companies in the world. It extracts iron ore, copper, diamonds, gold and uranium. It conducts its operations in countries such as Australia, Canada, New Zealand, the United States, South Africa and Mongolia
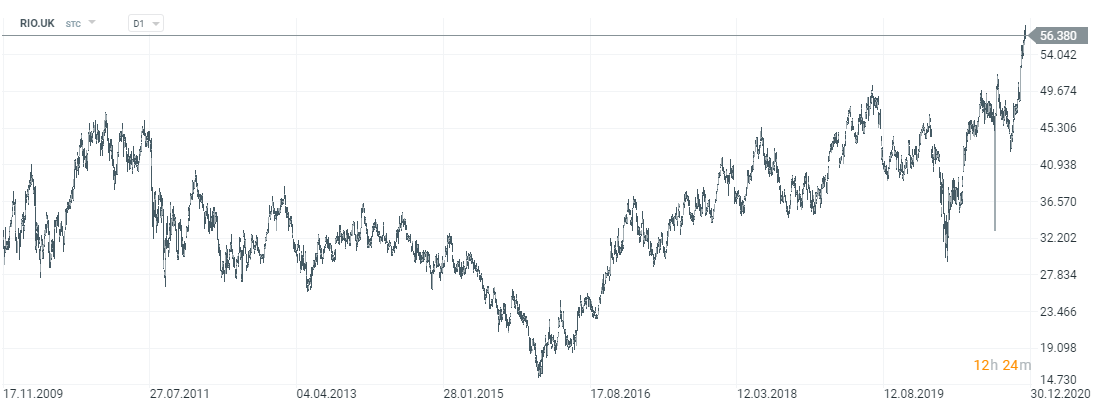
Rio Tinto Group Company Chart, D1 interval. Source: xNUMX XTB.
|
Rio Tinto |
2016 |
2017 |
2018 |
2019 |
|
revenues |
$ 33 million |
$ 40 million |
$ 40 million |
$ 43 million |
|
Operational profit |
$ 6 million |
$ 12 million |
$ 12 million |
$ 15 million |
|
Operating margin |
19,3% |
31,6% |
30,5% |
35,2% |
|
Net profit |
$ 4 million |
$ 8 million |
$ 13 million |
$ 8 million |
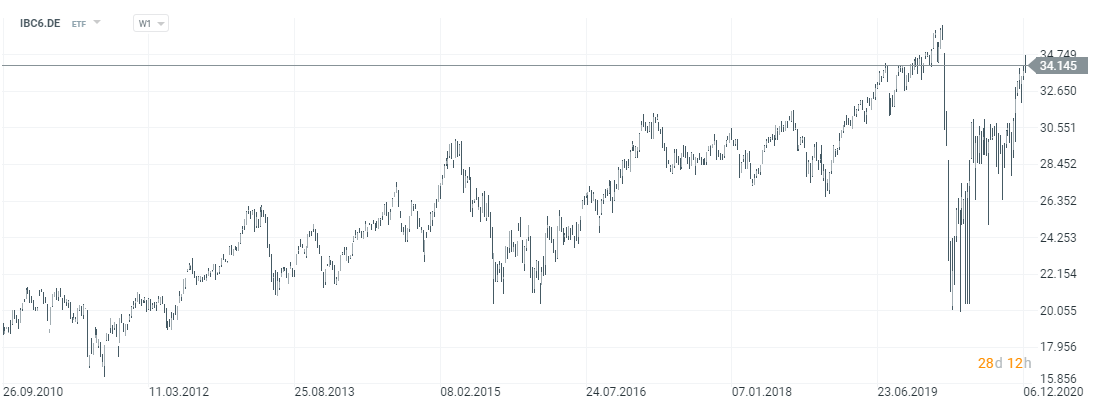
BHP Group
Another raw material company. The company is listed on the stock exchange in the USA, Australia and Great Britain. BHP Group deals with the extraction of iron ore, copper, coal and hydrocarbons. It operates in countries such as Algeria, Australia, Brazil, Chile and Canada. The financial year ends in June.
BHP Group chart, interval D1. Source: xNUMX XTB.
|
Rio Tinto |
2017FY |
2018FY |
2019FY |
2020FY |
|
revenues |
$ 38 million |
$ 43 million |
$ 44 million |
$ 42 million |
|
Operational profit |
$ 11 million |
$ 15 million |
$ 16 million |
$ 14 million |
|
Operating margin |
29,8% |
36,3% |
37,8% |
34,4% |
|
Net profit |
$ 5 million |
$ 3 million |
$ 8 million |
$ 7 million |
WiseTech
It is an Australian company offering software for the logistics industry. The company's main product is CargoWise, a tool for optimizing the supply chain. The company has over 17 customers, including 000 of the 42 largest logistics companies (including DHL, UPS, FedEx and Schenker). According to the data presented by the company, the annual customer retention is 50%. WiseTech is valued at approximately AUD 99 billion. The financial year ends in June 10.
|
WiseTech |
2017FY |
2018FY |
2019FY |
2020FY |
|
revenues |
AUD 154 million |
AUD 222 million |
AUD 348 million |
AUD 429 million |
|
Operational profit |
AUD 42 million |
AUD 58 million |
AUD 80 million |
AUD 81 million |
|
Operating margin |
27,3% |
26,1% |
23,0% |
18,9% |
|
Net profit |
AUD 32 million |
AUD 41 million |
AUD 54 million |
AUD 161 million |
ETFs for the Australian market
Of course, you don't need to invest in individual Australian companies to have exposure to this stock market. You can take advantage of the offer of ETFs, which will facilitate the decision-making process.
The largest ETF investing in Australian companies is iShares MSCI Australia (EWA). It has over $ 1,7 billion under management. The ETF was established in 1996 and its benchmark is the MSCI Australia Index. As of December 16, the ETF consisted of 66 companies. The management fee is 0,5% per annum. The average spread is at 0,04%. The structure of the fund's assets is similar to the main S&P ASX 200 index. Companies from the financial and material sectors dominate, with over 50% weight in ETFs. The top five include as many as 3 largest Australian banks. Top 5 as of December 16:
|
Company |
Sector |
Weight |
|
Commonwealth Bank of Australia |
Finances |
10,05% |
|
CSL Ltd. |
Healthcare |
8,83% |
|
BHP Group |
Raw Materials |
8,48% |
|
National Australia Bank |
Finances |
5,26% |
|
Westpac Banking Corporation |
Finances |
4,91% |
MSCI Australia (EWA) ETF Chart, D1. Source: xNUMX XTB.
You can also invest in ETFs in which Australian companies have a large stake. ETFs can be given as an example:
iShares Core Pacific ETF
-
- Issuer: Blackrock
- Annual fees: 0,09%
- Average Spread: 0,14%
The fund invests in Japanese, Australian, Singaporean, New Zealand and Hong Kong companies. The ETF consists of over 860 companies. The largest share is held by Japanese companies (approx. 68%) and Australia (approx. 20%). The ETF is quite well diversified by sector. The two largest (industry and finance) account for 33% of the portfolio. Technology companies account for approximately 10,4% of ETFs. As of December 17, ETF assets totaled $ 1,1 billion. The fund's benchmark is the MSCI Pacific Investable Market index.
iShares Core Pacific ex Japan ETF
-
- Issuer: Blackrock
- Annual fees: 0,20%
ETF invests mainly in Australian companies (approx. 61%) and Hong Kong-listed companies (approx. 27%). Singapore and New Zealand companies have smaller shares. In total, the fund comprises 129 companies. As much as 37% of the ETF shares are held by the financial sector (37%). The next largest sector is the raw materials sector (12%). At the end of December 17, assets under ETF management were $ 2,2 billion. The fund's benchmark is the MSCI Pacific ex-Japan index.
FTSE Developed Asia Pacific ex Japan UCITS ETF (VAPX)
-
- Issuer: Vanguard
- Annual fees: 0,15%
ETF invests mainly in Australian companies (approx. 41%) and Korean companies (approx. 31%). Hong Kong, Singapore and New Zealand companies have smaller shares. In total, the fund comprises 394 companies. The fund is dominated by financial (approx. 26%) and technology companies (approx. 17,5%). At the end of December 17, assets under ETF management totaled $ 750 million. The fund's benchmark is the FTSE Developed Asia Pacific ex Japan index.
Where to invest in ETF
More and more forex brokers have quite a wide range of ETFs and CFDs. For example on XTB today we can find over 400 instruments of this type, in Admirals almost 397, a Saxo Bank almost 3000.
| Broker |  |
 |
|
| Country | Poland | Denmark | Great Britain |
| The amount of ETF on offer | approx. 400 - ETF approx. 170 - CFDs on ETFs |
3000 - ETF 675 - ETF CFDs |
397 - ETF CFDs |
| Min. Deposit | PLN 0 (recommended min. PLN 2000 or USD 500, EUR) |
0 PLN / 0 EUR / 0 USD | PLN 5 |
| Platform | xStation | SaxoTrader Pro Saxo Trader Go |
MetaTrader 5 |
CFDs are complex instruments and come with a high risk of losing money rapidly due to leverage. From 72% to 89% of retail investor accounts record monetary losses as a result of trading CFDs. Think about whether you understand how CFDs work and whether you can afford the high risk of losing your money.
Summation
Australia benefits from the development of Asian markets. The further dynamic development of Asia will be a factor supporting the development of the Australian economy. Financial and raw material companies dominate the ASX exchange. Although there is a large percentage of companies from the "old economy", you can also find technology companies. It is a developed economy, but mainly related to Asia. For this reason, the Australian market is an interesting idea to diversify an investment portfolio for a European investor.


