


Traders' sentiment - what is it and how to use it in trading?

The foreign exchange market, like any other, is created by its participants, both smaller and larger. The decisions of each of them are dictated by many factors, many of which are probably immeasurable. Such immeasurable factors include mental factors, a subjective view of the market independent of hard data that pertain to a given asset. The advice for this is the closure of all this subjectivity and humors investors in response to one question regarding the attitude to a given market in a given period. This is what the traders' sentiment is about.
Research centers regularly ask a specific group of market participants about their individual feelings about how it will develop in the future. The graph created on the basis of the answer allows to analyze it and to search for turning points and dependencies in relation to the base market chart. Almost every sentiment indicator is built differently, as we will see further.
The first sentiment indicator
One of the oldest indicators of sentiment is AAII created by American Association of Individual Investors. However, there are doubts about this and it all depends on what we consider as such an indicator. Some people are inclined to consider the statistics of the number of rising and falling companies, published every few days, as such an indicator. If companies have been falling for a few days in a row, it may attract investors' attention and generate short-term demand. Theoretically…
Types of sentiment indicators:
- sentiment / positioning indicators small clients of individual brokers, e.g.
- Dukascopy's sentiment,
- Admiral Markets sentiment,
- IG Markets sentiment,
- XTB sentiment available to clients after logging into the platform xStation5.
- COT report - published by the independent agency Commodity Futures Trading Commission (CFTC). It presents data on open positions by futures traders at the end of the trading session (usually Tuesday). The agency distinguishes three categories of traders who are surveyed:
- Commercial traders - these are most often institutions securing their real positions on the futures markets. Their involvement in the market should not be taken into account as they can hold losing positions for a long time, which are really only hedges against a change in the price of the goods they own.
- Non-commercial traders - they are big investors with sizeable capital (hedge funds, big players focused mainly on profit). Their involvement should be given the greatest importance.
- Individual traders.
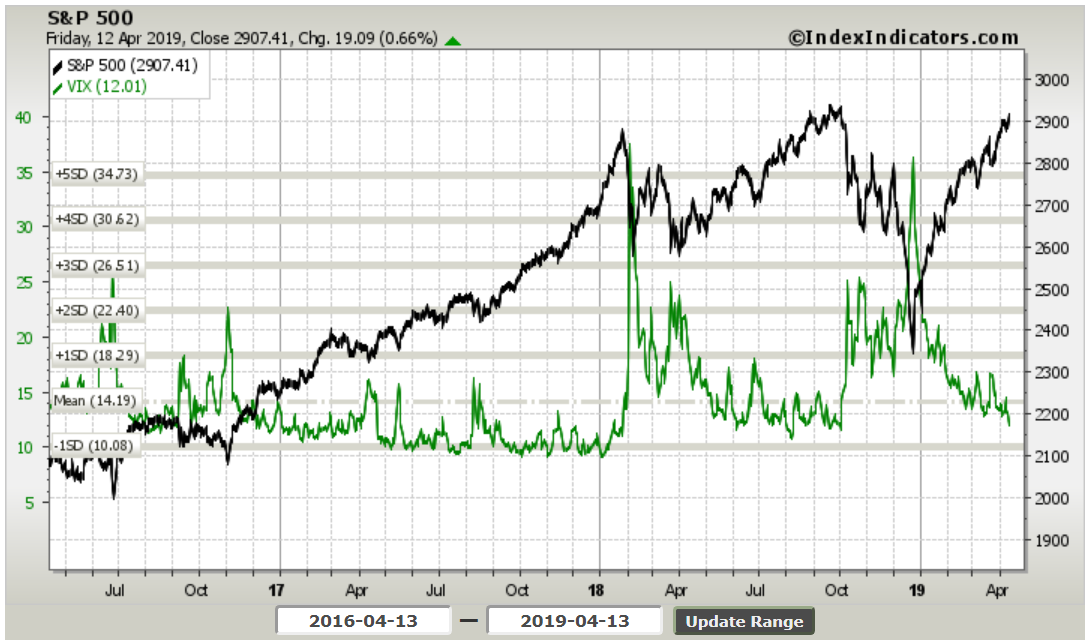
- VIX fear index - although called fear index, is actually an indicator of volatility in the S & P500 market. Its rise to high or extreme values may suggest that we are approaching the end of a correction or market panic. Low volatility means stable increases or decreases without significant corrections. Major corrections or crises are usually accompanied by high values on the VIX indicatoras shown below.
- US ten-year bond yields - their decline means a global increase in risk aversion. This can give us some information about the sentiment by using the knowledge in which currencies are invested in such periods.
- Mood Index Investors (INI) - the Polish sentiment indicator is a weekly survey conducted by the Association of Individual Investors. The indicator measures the percentage of investors with a bullish, bearish and neutral bias towards the stock market over the next 6 months. Members and supporters of the Association take part in the survey.
- AAII Investor Sentiment Survey - was established in 1987. It measures the sentiment of individual investors towards US Wall Street. It is conducted among members of AAII (American Association of Individual Investors).
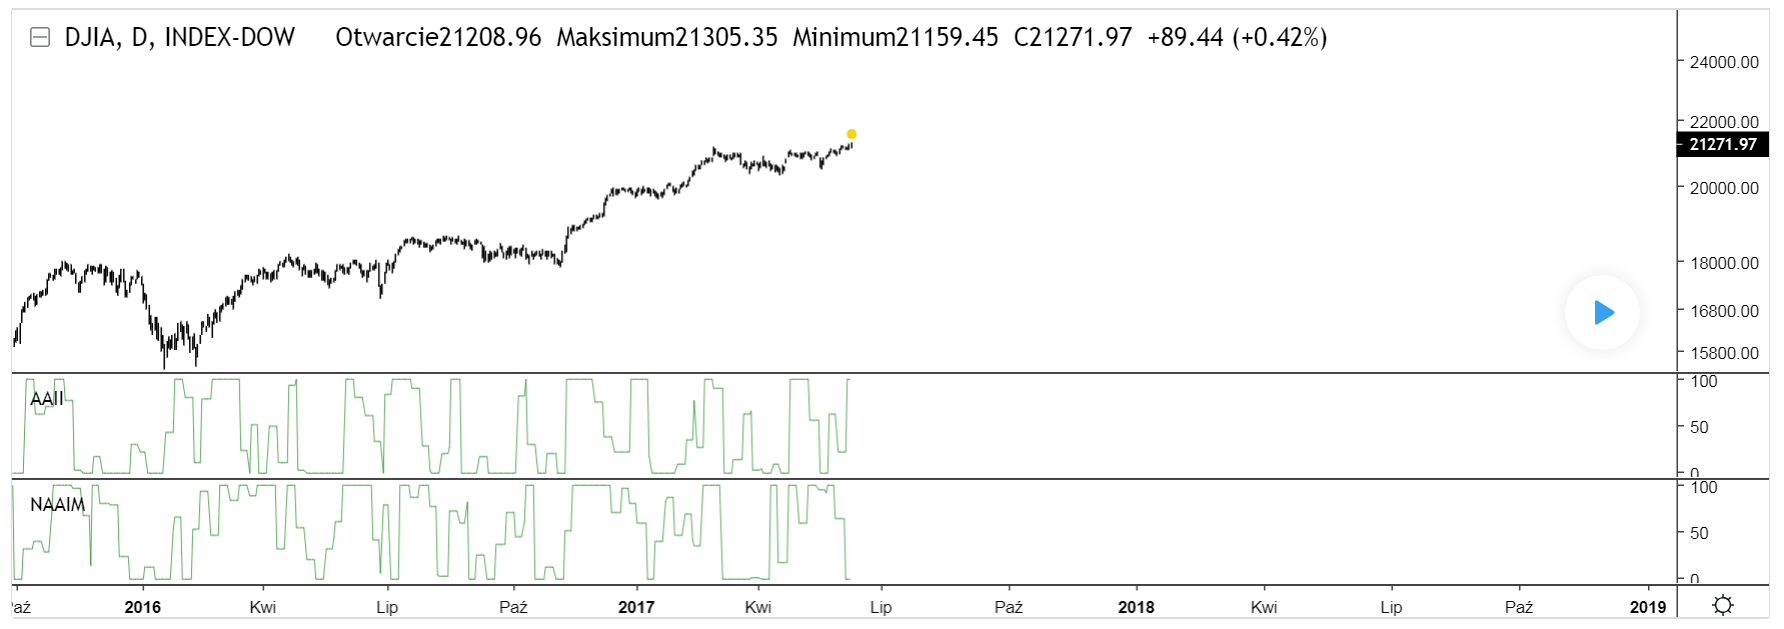
- NAAIM Exposure Index - indicator created by the National Association of Active Investment Managers. Contrary to AAII, this indicator measures the mood of managers who have much more capital at their disposal. Below is shown difference between the AAII and NAAIM indicators. It is worth looking at at what moments there are divergences of these indications.
- CNN Fear and Greed Index - this index, unlike the others, is not based on questioning respondents. Seven different indicators are used for its construction including momentum on the S & P500 market and the VIX index.
- The Hulbert Gold Newsletter Sentiment Index (HGNSI) - gold market sentiment indicator.
The use of sentiment indicators
- traditional
The traditional approach to using indications of market sentiment is to make confirmation of it for technical analysis. If we determine an upward trend on a given asset, however, after analyzing sentiment indicators, we notice that the number of long positions is at very high or extremely high levels, it is worth thinking deeply about opening such a position. If we all have longi, then we can become typical hill buyers.
- kontrariańskie
The forerunner of the Counter-Crass, or the opposite (in spite of) approach to indications of sentiment indicators was Humphrey B. Neill, who published the book The Art Of Contrary Thinking in 1954. Assuming that most people are usually wrong, he proposed an investment approach based on the principle of opposition to the prevailing attitude of the majority of market participants. He considered extreme pessimism an ideal shopping opportunity. Widespread optimism was the perfect time for him to close the already open purchase transactions.
Example
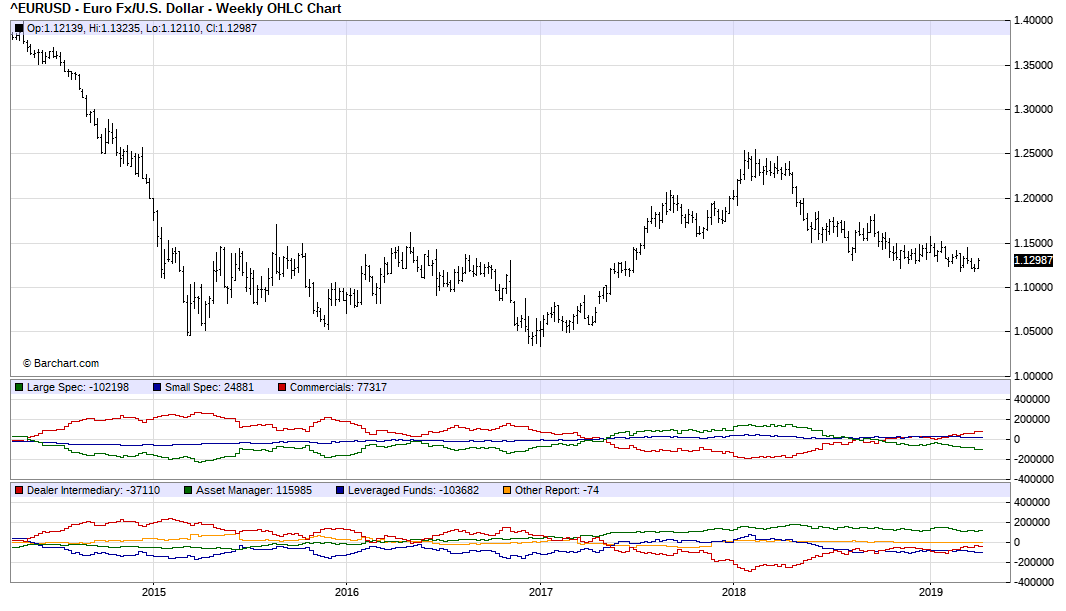
COT weekly chart for the EURUSD market. Source: www.barchart.com
As we can see above Large Speculators they are dominant players that run the market. Commercials they fully cover their positions a Small Speculators, that is, small investors are always somewhere in the middle without affecting either the attitude of one or the other.
Maximum index readings are always a hint to look for the potential for changing the trend. The convergence of all three indications near the zero point may be a certain shake up in a given market. It is worth to analyze all dependencies.
Summation
Sentiment indicators satisfy our curiosity as to what and when other market participants invest. They present trends in the broad market, but they can never be used as investment signals. They can be treated as a confirmation for our transactions or as a warning against the possibility of running out of an ongoing trend. It should also always be remembered that just like in poker, we have no certainty as to what intentions the respondents had. Some indicators because of their construction are undoubtedly susceptible to manipulation, I think.
Remember that the tools discussed in this article, like any other, can not be an independent investment tool. Remember to properly manage your capital and risk control.


