


Range Bars and Renko charts in cTrader Mobile 3.11

Despite the turmoil on the market, developers spotware are not fired from work. In the latest update of the mobile version of the cTrader platform, marked as 3.11, there are, among others, Range Bars and Charts Renko. The full list of news is presented below.
Be sure to read: Review of the cTrader transaction platform
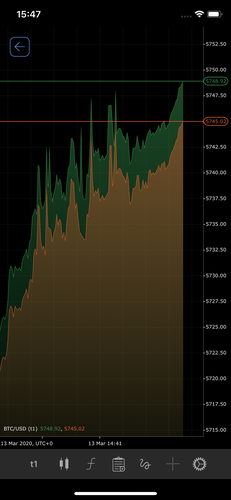
Tick charts
Tick charts are based on single price movements (it is not the same as the number of pips or points). One "period" is created precisely on the basis of the number of these changes and only then "closed". Basically, bar charts provide information about market volatility.
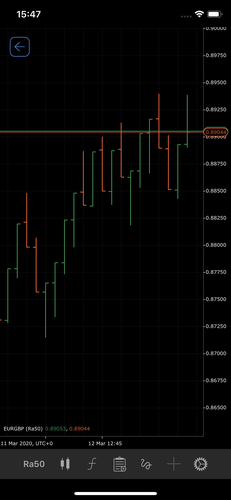
Range Bars
The Range Bars chart is based on price changes and allows traders to better analyze the market for volatility. By configuring this type of chart, we select the preferred price range, and then each time when the movement of the entered range is achieved, a bar is created on the chart.
Renko charts
Renko charts are based on price changes and create a new bar after reaching a certain number of pips since the previous bar was closed. They help to better identify support and resistance levels, as well as price formations.
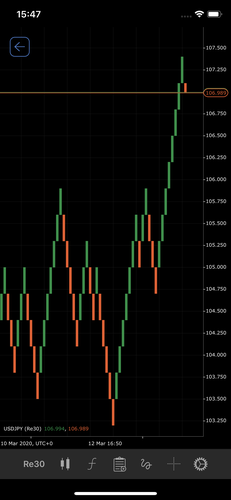
Chart improvements in full-screen mode
In addition to adding new elements, the existing functions have also been improved, including:
- Improved Fibonacci Retracements - Equipped with additional movable "edge precision".
- Hiding the titles of indicators, which allows you to increase the clarity of the charts and "free up" space for technical analysis purposes.
- The ability to open the screen New order from the chart panel QuickTrade, so you don't have to close full-screen charts.


