Parabolic SAR - methodology and methods of use
In previous articles published on the Forex Club we have already approached the ideas average daily range (popularly ADR), and Bollinger bands. Today we will focus on another indicator that can be successfully used in everyday trading - Parabolic SAR. This is very interesting trend indicator, which is mainly based on two key factors: I appreciate and time. From the English abbreviation SAR means "stop and reverse", which means literally translated stop and turn around. It can be said that this is one of the more complex tools of this type when it comes to basic calculations. We will briefly discuss the indicator itself and present ways of using it.
Parabolic SAR - basic information
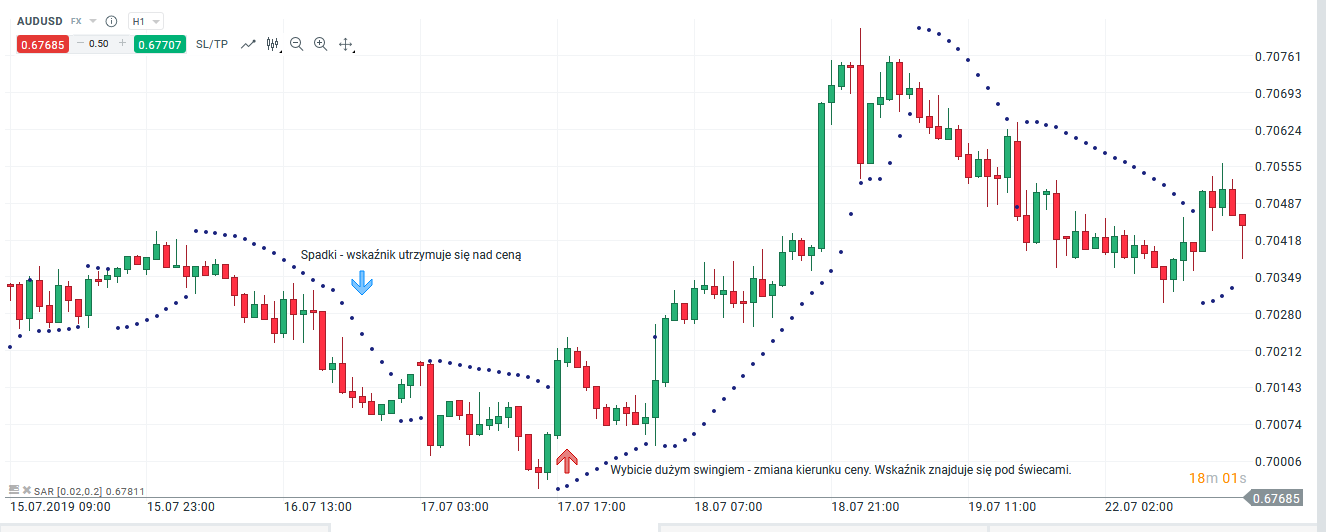
The most important thing to observe when using SAR is that the indicator persists under the price when it moves in an upward trend. The idea of the indicator may be that it signals stop loss shift, along with the ongoing upward trend. If the market remains stable, then the indicator will never fall. SAR shows us a potential place where we can secure unrealized gains. If there is a change of direction after the increases, the indicator will automatically be above the candles. In downward trends it can be used as trailing stop. This example can be seen in practice. During declines, SAR stays above the price, acting like a mobile position closing order. When there is a stronger rebound in the form of a large demand candle, which "Hits" the indicator, the stop loss may be activated. At the same time, in such cases, we are dealing with a change in sentiment to growth.
Sensitivity of the indicator
Another important aspect to focus on when using an indicator is how closely it follows the price. This is very important because the higher the sensitivity level, the higher faster SAR will change direction. The key to setting this parameter are the trader's individual predispositions. If you prefer scalping, or you are a typical day-trader, it is better to set high sensitivity. In turn, for people playing for larger moves, at higher time intervals, who hold the position for a long period and do not leave it with small backward movements, the low value of this parameter will be a much better choice. By default, on trading platforms, the indicator sensitivity is set to a level around 0.2.
Be sure to read: Price gaps - types and characteristics
The use of Parabolic SAR
Like any trend indicator, SAR is also not an ideal indicator and has some disadvantages. Primarily works well during strong moves, but fails on the variable market, which moves within certain ranges. How to solve such problems in practice? Of course, like any other indicator, SAR should not be used alone. It's never a question of getting 100% effectiveness. It is always recommended to use additional filters that can amplify specific signals. Note the following connections:
1. ADX / moving average
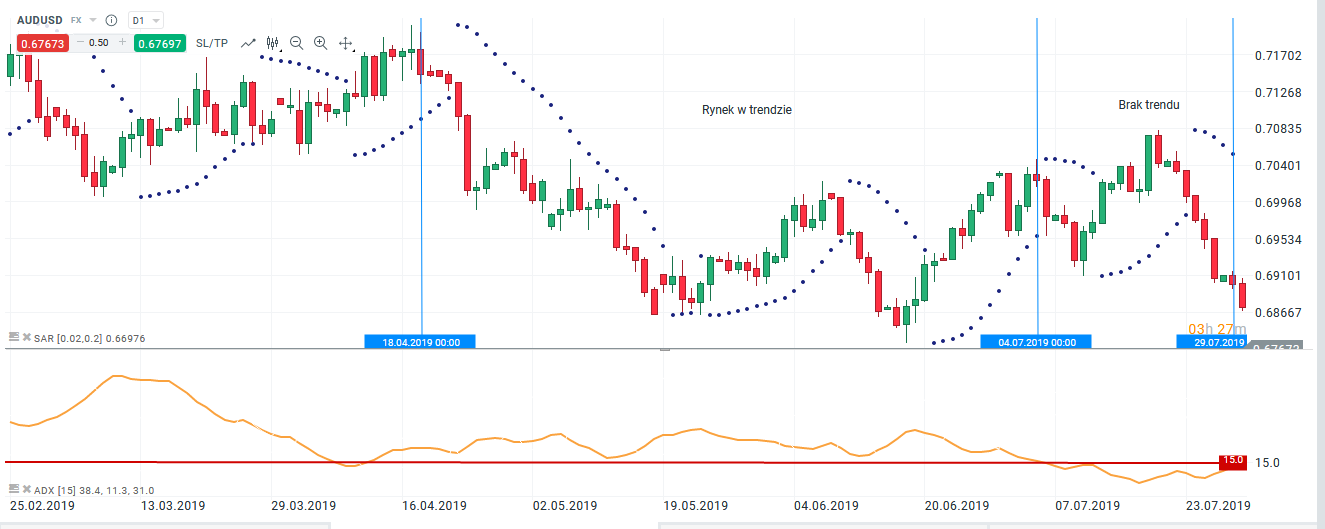
An interesting combination is a SAR mix with ADX, or a moving average. As I mentioned before, the indicator is not performing well in markets moving in ranges. In the first case ADX can act as a trend indicator. If it stays above 15, for example, the market is trending and only on such a market are we looking for potential entry opportunities. If the ADX values are lower than 15, we assume consolidation and refrain from taking a position.
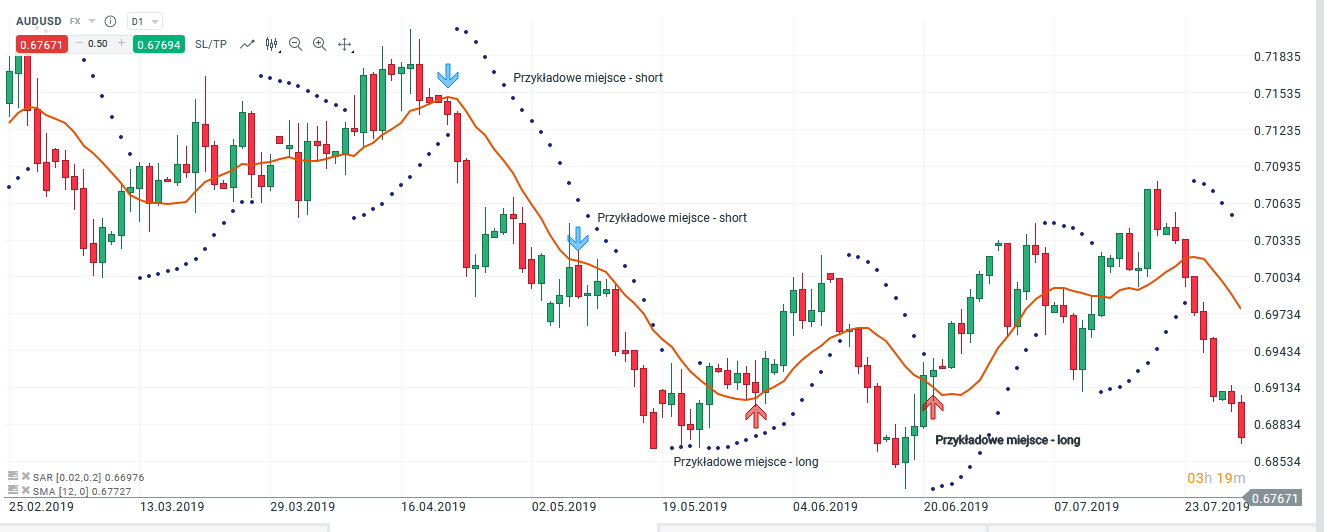
As for the moving average, it can be a kind of directional filter. When the price is above average, we are only looking for buy transactions and SAR acts as our trailing stop. The same situation - the price is below average, we are only looking for sales transactions.

Combination of Parabolic SAR and moving average indicators, AUD / USD, D1 interval. Source: xNUMX XTB
2. Stochastic oscillator
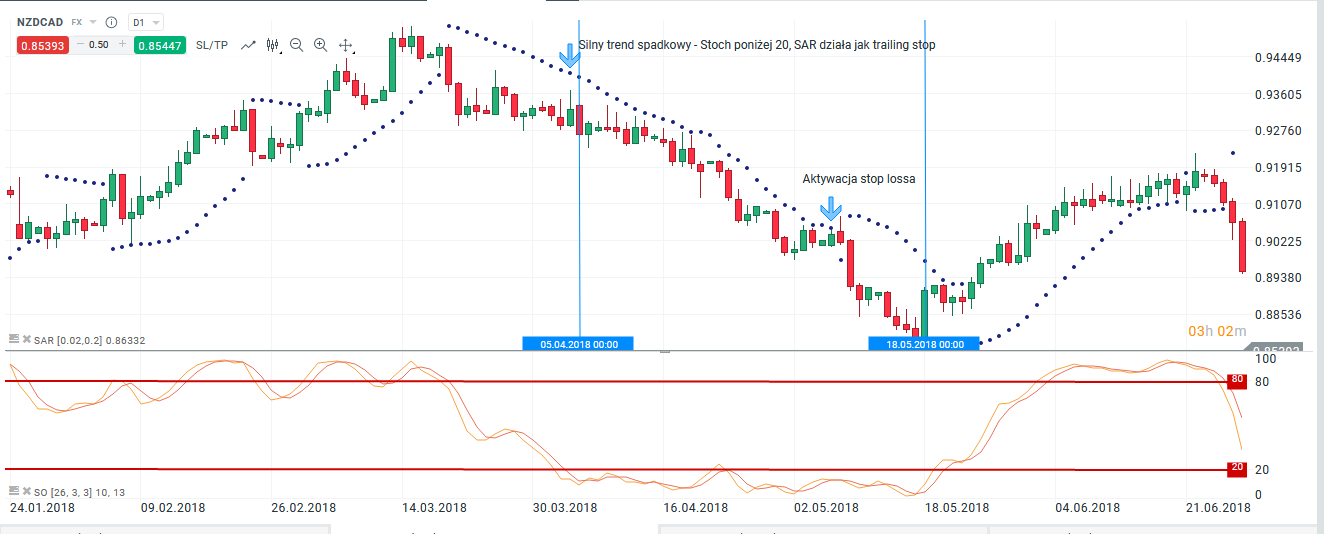
Another interesting tool that works well with SAR is the stochastic oscillator. This indicator signals strong trends when its lines are above 80 or below 20. The Stochastic confirms a long-term downtrend as the line breaks the 20 level and stays there for an extended period of time. The SAR can then signal the target stop loss level.

Combination of Parabolic SAR and Stochastic indicators, NZD / CAD, D1 interval. Source: xNUMX XTB
Summation
Always using these types of tools, it is worth remembering two basic principles. First of all: indicators are not intended to provide us with pure trade signals. They show some information regarding the current price. It is the trader's task to modify the data from the indicator so as to get a good idea and a good setup in a given market. Second: remember that creating signals is not about 100% effectiveness, but about a favorable profit-risk ratio.


![Forex Club – Tax 9 – Settle tax on a foreign broker [Download the Application] Forex Club - Tax 9](https://forexclub.pl/wp-content/uploads/2024/02/Forex-Club-Podatek-9-184x120.jpg?v=1709046278)
![Trading View platform – solutions tailored to the needs of traders [Review] trading view review](https://forexclub.pl/wp-content/uploads/2024/03/trading-view-recenzja-184x120.jpg?v=1709558918)
![How to connect your FP Markets account to the Trading View platform [Guide] fp markets trading view](https://forexclub.pl/wp-content/uploads/2024/02/fp-markets-trading-view-184x120.jpg?v=1708677291)
![How to invest in ChatGPT and AI? Stocks and ETFs [Guide] how to invest in chatgpt and artificial intelligence](https://forexclub.pl/wp-content/uploads/2023/02/jak-inwestowac-w-chatgpt-i-sztuczna-inteligencje-184x120.jpg?v=1676364263)


![Izabela Górecka – “Success on the market depends not only on knowledge, but also on emotional stability” [Interview] Izabela Górecka - interview](https://forexclub.pl/wp-content/uploads/2024/04/Izabela-Gorecka-wywiad-184x120.jpg?v=1713870578)
![WeWork – the anatomy of the collapse of a company valued at $47 billion [WeWork, part II] wework bankruptcy story](https://forexclub.pl/wp-content/uploads/2024/04/wework-bankructwo-historia-184x120.jpg?v=1711729561)
![Adam Neumann – the man who screwed up Softbank [WeWork, part AND] adam neumann wework](https://forexclub.pl/wp-content/uploads/2024/04/adam-neumann-wework-184x120.jpg?v=1711728724)


![How to transfer shares to another brokerage office [Procedure description] how to transfer shares to another brokerage house](https://forexclub.pl/wp-content/uploads/2024/03/jak-przeniesc-akcje-do-innego-biura-maklerskiego-184x120.jpg?v=1709556924)
![The most common mistakes of a beginner trader - Mr Yogi [VIDEO] Scalping - The most common mistakes of a beginner trader - VIDEO](https://forexclub.pl/wp-content/uploads/2024/03/Scalping-Najczestsze-bledy-poczatkujacego-tradera-VIDEO-184x120.jpg?v=1711601376)
![Learning patience: No position is also a position - Mr Yogi [VIDEO] Scalping - Learning patience - No position is also a position - VIDEO](https://forexclub.pl/wp-content/uploads/2024/03/Scalping-Nauka-cierpliwosci-Brak-pozycji-to-tez-pozycja-VIDEO-184x120.jpg?v=1710999249)
![When to exit a position and how to minimize losses - Mr Yogi [VIDEO] Scalping - When to exit a position and how to minimize losses - VIDEO](https://forexclub.pl/wp-content/uploads/2024/03/Scalping-Kiedy-wyjsc-z-pozycji-i-jak-minimalizowac-straty-VIDEO-184x120.jpg?v=1710336731)


![Learning patience: No position is also a position - Mr Yogi [VIDEO] Scalping - Learning patience - No position is also a position - VIDEO](https://forexclub.pl/wp-content/uploads/2024/03/Scalping-Nauka-cierpliwosci-Brak-pozycji-to-tez-pozycja-VIDEO-300x200.jpg?v=1710999249)


