


Fibonacci tools

Who was Fibonacci?
Fibonacci tools and Leonardo Fibonacci. Leonardo was an Italian mathematician living in the 1202th century who authored the famous book from XNUMX - "Liber abaci". Leonardo, during his work, found the trail of a very interesting sequence, which was eventually named after him.
The basic sequence of Fibonacci numbers looks like this: 1, 1, 2, 3, 5, 8,13, 21, 34, 55, 89, 144, 233, 377, 610, ... and it goes on forever. Each of the numbers listed in the sequence is the sum of the previous two (except the first and second). So it's a recursive sequence, and at the same time, the Fibonacci sequence is the first known sequence of its kind. The result of dividing each number in the sequence by its previous one always hovers around the value 1,618 that is named the number of the zloty division Φ. On the other hand, if we divide a certain number from a string by the one that has two items earlier, we will get a result near 2,618. The quotient of numbers that are spaced apart from 3 places will give us approximately the result of 4,236.
What does Fibonacci do in the financial markets?

Leonardo Fibonacci. Source: Wikipedia
Regarding the use of Fibonacci numbers in practice, the results from the above numerical sequence are used as the inverse of these quotients expressed as a percentage (23,6%, 38,2%, 61,8%). They are perceived as an ideal representation of the proportions found in nature. A large group of people believe that the processes occurring in the natural environment are based precisely on these factors. If you look at it more broadly, changes in the prices of financial instruments may also be perceived as part of the environment (financial markets) in which people associate. The idea was therefore to use Fibo coefficients to analyze these exchange rates, share prices or other instruments to determine future course behaviors.
Fibonacci tools
In order to enable the application of the analysis of financial instruments with the help of Fibonacci coefficients, various types of technical analysis tools have been developed. Investors use them in researching the relationships taking place on price charts. Those are:
- Elevations (levels),
- Range lines (expansion),
- Cycles (time zones),
- Range,
- Channels.
The most popular and most frequently used in trading are the first two, that is, the Fibonacci lifts and range lines, also known as the Fibonacci expansion.
READ ALSO: Abolition of Fibonacci on MetaTrader 4
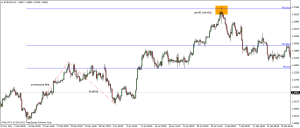
The Fibonacci Abolition
The abolition of Fibo (Fibonacci Retracements) are used to mark the turning points of the market, especially to indicate the places where the correction ends, after which the market returns to the original movement. When measuring the range of a given wave, Fibonacci levels are listed with potential turning points. By applying the retracement tool to the full wavelength, the percentage levels corresponding to the Fibo levels are automatically applied. The main levels are: 23,6%, 38,2%, 50%, 61,8%, 100%, 161,8%, 261,8%, 423,6%. Some also use additional levels, such as: 68,5%, 78,6%, 88,6%, 127,2%, 150%, 200%, 223,6%.
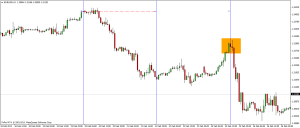
Fibonacci expansions
Expansion tool (Fibonacci Expansions) is used to determine the theoretical end points of the continuation of movement after correction. By measuring the trend wave, taking into account the correction wave that followed, levels are determined at which the next correction or trend change may occur. The basic levels of expansion are: 61,8%, 100%, 161,8%. These are the ratios of the plotted trend wave measured from the end of the correction.
Fibonacci cycles
Fibo cycles (Fibonacci Cycles) also have the task of determining turning points, however, they are not based on price but on time. The time of the trend wave is measured in order to be able to indicate the theoretical places where the correction that occurred after it ended.
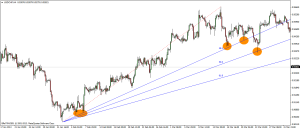
Fibonacci fans
Fan Fibo (Fibonacci Fan Lines) is a rarely used tool, but it has a lot of potential. It is based on traditional trend lines. When measuring a longer wave of a trend, several lines are automatically drawn from the beginning of the wave, with different slopes, based on the Fibo factors. They designate possible support / resistance levels, which are at the same time alternative trend lines that inhibit the rate before changing direction. By standard, the ratios of 38,2%, 50%, 61,8% are used.
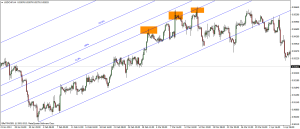
Fibonacci channels
Price channels (Fibonacci Channels) based on the Fibo factor, based on the standard technique of channel determination. The drawn straight lines defining the bank are the starting point for the remaining parallel lines, the distance of which depends on the Fibonacci coefficients (standard ones are 61,8%, 100%, 161,8%, 261,8%). In this way, successive channels are plotted in which the price can move after leaving the original corridor.
Harmonic Trading
More complex analysis techniques and a strategy based on Fibo tools - the so-called Harmonic Trading (harmonic trade), where the foundation is Fibonacci geometry.


