


Overlapping Charts [Indicator for MetaTrader 4]

Knowledge of the correlation on Forex market is one of the methods that can undoubtedly improve our effectiveness trading. Correlation is, in other words, interdependence, a phenomenon that shows us whether the prices (and if so to what extent) of individual values change relative to each other. Correlation coefficients range from -1 (negative dependence), through 0 (no dependence), to 1 (positive correlation). A proper, market correlation must contain a high value of the coefficient.
There are two types of correlation:
- Positive - a correlation in which the price movements of currency pairs move in one direction. This means that the charts of two similar instruments have the same direction.
- Negative - a correlation in which the price movements of currency pairs change in different directions. This means that there is an uptrend of one instrument "Mirror image" the chart of the second instrument, which in this case will be pointing down.
A helpful tool that clearly illustrates the dependencies is the function of overlapping charts. Currently, some trading platforms have such an option. Unfortunately, on the MetaTrader 4 platform, which is already old (but also on MetaTrader 5 - sic!), We will not find it as standard. Certainly the big advantage in MT4 is the ability to add your own indicators, scripts or automatic trading strategies, which are not lacking in the network. Thanks to this, we can improve our commercial profile with an additional module.
This time we will focus on the indicator that was created by Investio - an educational website, created by trading enthusiasts since 2012. Since then, the group has gathered over a dozen thousand people actively interested in trading on leveraged instruments and has prepared dozens (if not hundreds!) Of educational materials. After a short registration, we get free access to some tools. We will check how one of their works works, namely graphs overlap indicator.
Operation and settings
To access the indicator, copy the downloaded file and put it in the MetaTrader 4 folder - Indicators (if you don't know how to do it, read Have Artykuł). After restarting the MT4 platform, it will appear in the tab Own.
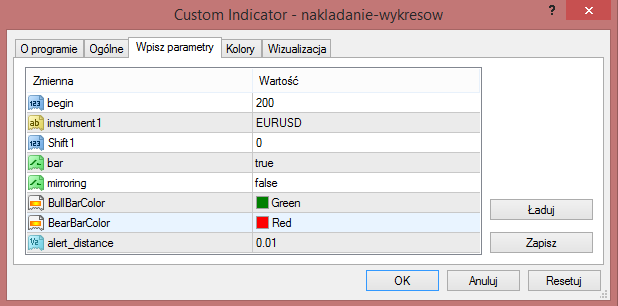
Pointer Settings:
- Begin - number of periods for which the second chart will be superimposed
- Instruments 1 - in this field, we enter the symbol of the graph we want to overlay. Eg EURUSD
- shift 1 - the default value of 0 means that the dates of the overlaid charts will be compatible with each other
- Bar - choice of candlestick chart - true or line chart - false
- Mirroring - the applied chart will be exactly the opposite - true, false - turns off this option
- Bull and Bear Ball Color - the colors of the candles on the overlay chart
- Alert distance - the platform will notify us when two charts relative to each other reach a certain amount in pips (0,01 is the default setting for 100 pips). Attention: Due to the fact that currency pairs and indices are given in different units, the alert parameter should be reset to much higher levels, e.g. 5.0. If we do not do this, the alert will appear all the time and it will be completely unnecessary information for us.
Applying an indicator on a chart
To check the correlation of selected currency pairs. it is worth using the calculator available on the website www.investing.com. Using it, we check the positive and negative correlation for the main currency pair EUR / USD using the new indicator.
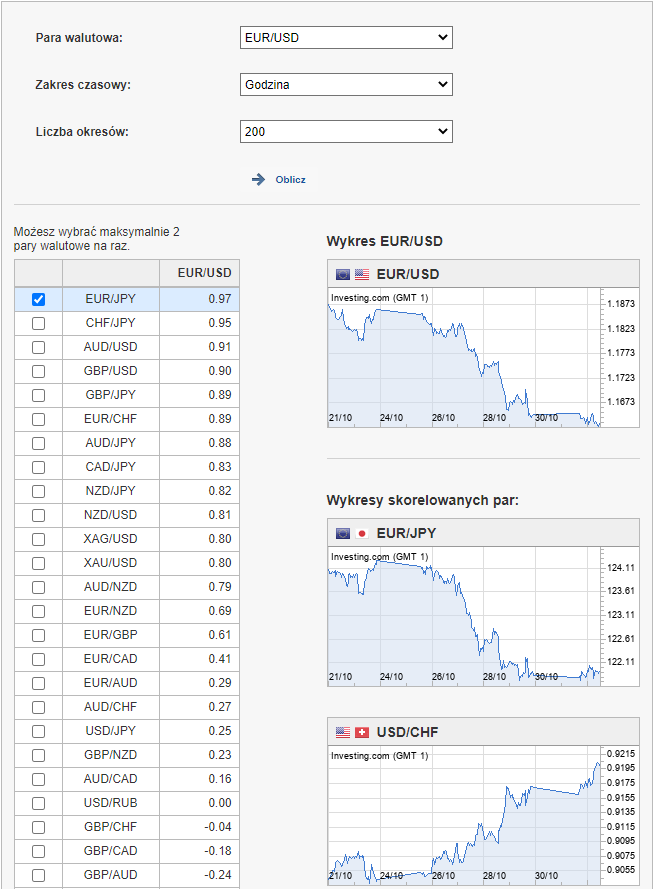
The parameters we adopted for the calculations are:
- Time range - H1
- Number of periods -200
For the above values, the EUR / USD pair strongly correlates positively with the EUR / JPY pair, and negatively with the USD / CHF pair. Below we see directly superimposed charts for both configurations.
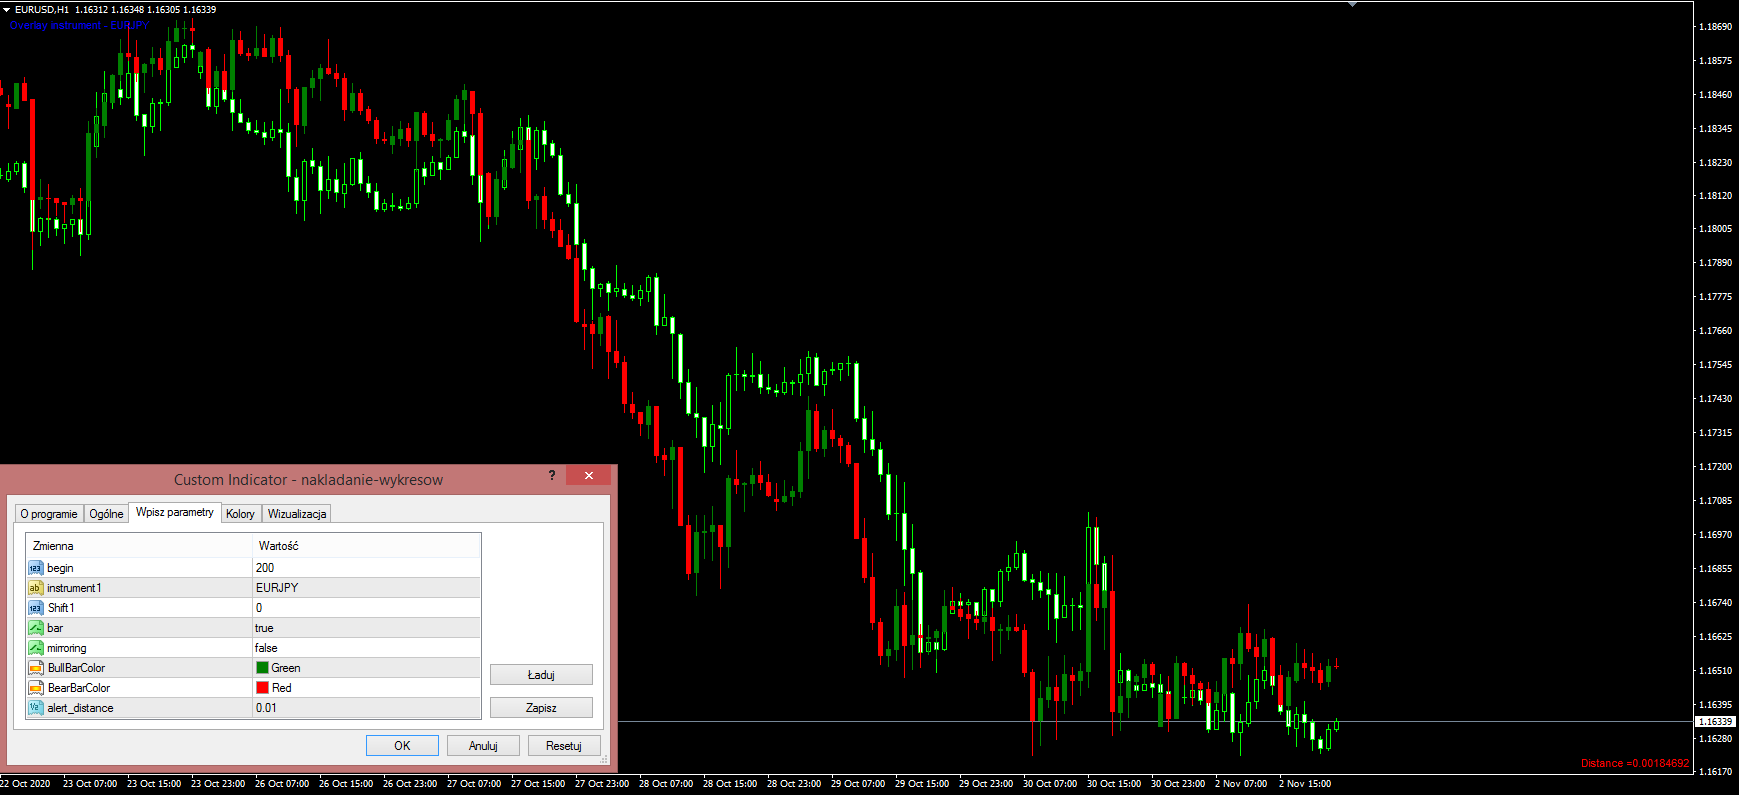
EURUSD and EURJPY - positive correlation, coefficient 0,97.
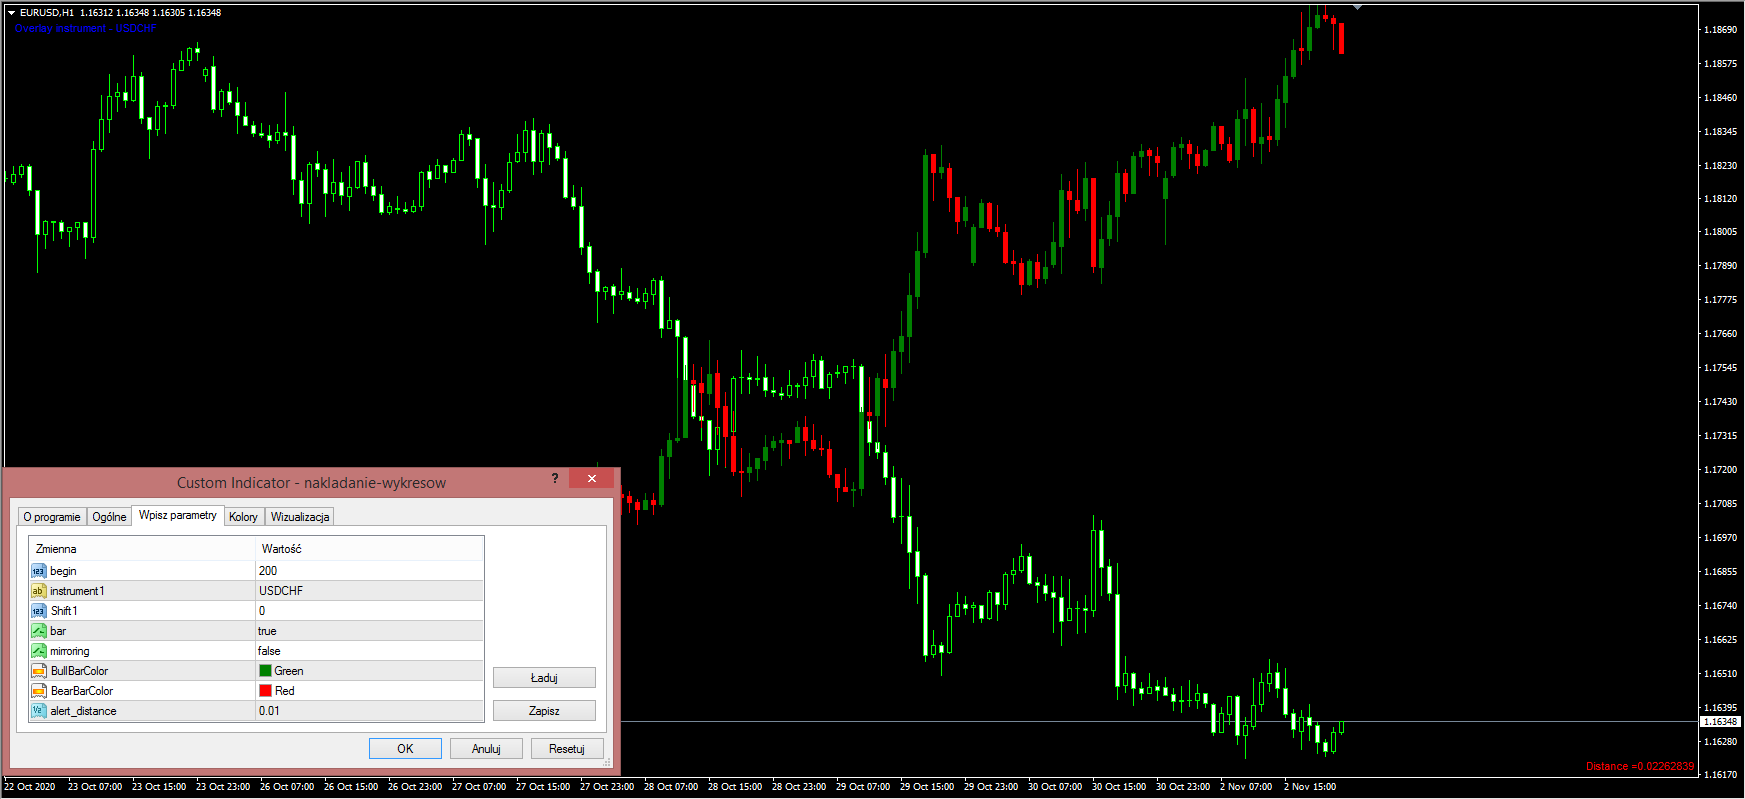
EURUSD and USDCHF - negative correlation, coefficient- 0,99.
Summation
The chart overlap indicator shown here works fine and can be extremely useful in trading. It is true that selected currency pairs (but not only!) Are highly correlated with each other, and recognizing them can play an important role in our trading. This will undoubtedly help to reduce the risk of our portfolio and better assess the current situation. There is no effective zero-one strategy in trading, but the knowledge of economic relationships and correlations greatly enriches ours knowledge and can give you an extra edge.


