


Momentum - the key to understanding price charts

The momentum methodology is very often underestimated by investors. In my opinion, it is crucial when it comes to understanding price charts and, consequently, making profitable investment decisions. In this article we will answer the question of what is the momentum and how to use it in everyday trading.
Be sure to read: Supply / Demand Levels - The most important assumptions
Definicja
Momentum is nothing else but strength of a given trend. The term can also mean large / strong candles. The key to understanding the entire methodology is the right interpretation. The whole concept is closely related to the trend, which is why we distinguish its two basic types:
- bull (in an uptrend),
- bears (in a downward trend).
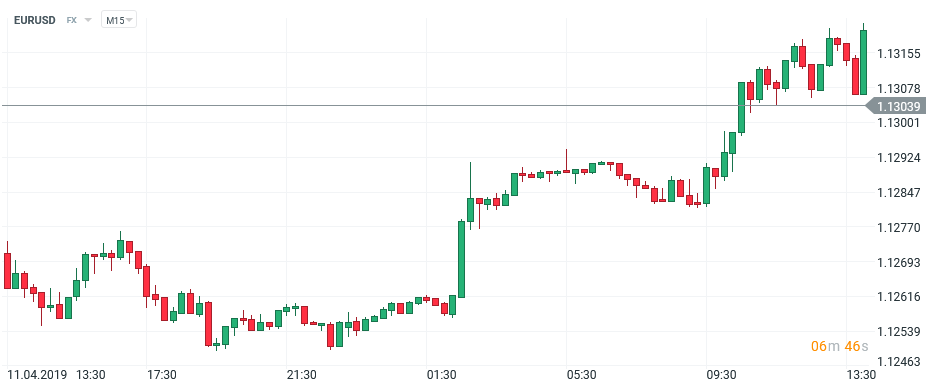
Example of strong bullish momentum, EURUSD currency pair, XTB xStation 5
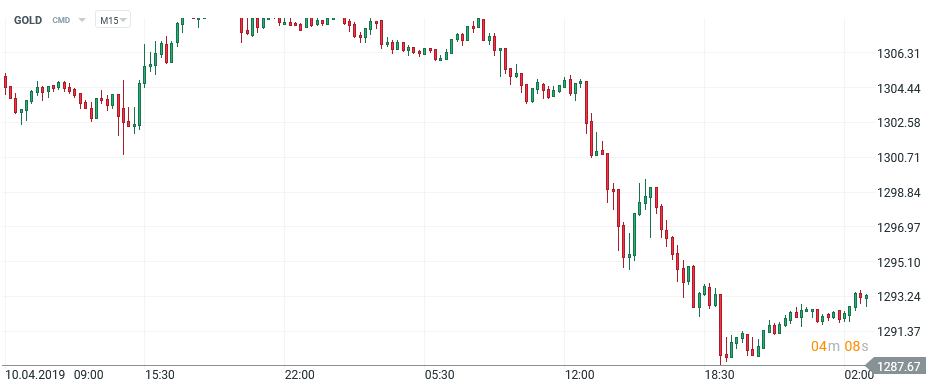
An example of a strong bears momentum, GOLD, XTB xStation 5
We can also distinguish two ways of looking at the dynamics of the trend. The first in relation to the general trend, the second in relation to individual individual candles. A book candle best showing the strength of momentum, has long body and slight shadows. Similarly, candles from short bodies, and long shadowsthey do not show us the strength of momentum in a given trend.
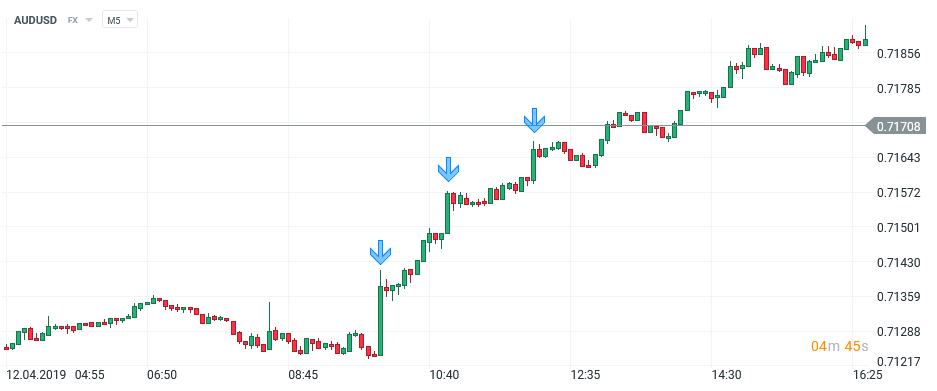
Candles illustrating strength in trend, AUDUSD currency pair, XTB xStation 5
Momentum observation and application in everyday trading
The key to success is proper market observation. It should be remembered that the games in line with the trend have a much greater chance of success. The first thing to start with is the overall trend assessment. If we already have a specific trend in a given market, momentum can be a great complement to our strategy, because it can show us the strength of the trend, or signs of his reversal. When using the methodology, you can support yourself with the tools that we use in our trading every day. Many traders effectively combine the momentum with, for example, trend lines, with mediums or Bollinger bands. What I personally most like when it comes to momentum is combining methodology with key levels of support and resistance. For example, let's look at the EURJPY market.
1. As for the general sentiment on the D1 chart, in my opinion, we can still observe a downward trend. From the tangent we see signs of momentum strength, both from the demand and supply side. This may slightly distort the image of the market, however, an appropriate interpretation, and the determination of key levels, can protect us against too early assumption about, for example, change in sentiment for an upward trend.
2. In the graph, we set levels of resistance that are of interest to us. I only set resistance because I think that the sentiment is inheritance and that is why I try to play only for dips. The key level for the whole trend is in my opinion around 127.670. How do I use the momentum in everyday trading? The principle is simple. I watch the reaction and arrangement of candles in the area of designated levels. The breakthrough of the first level, i.e. the 126.660 area, will be the first signal for me to witness a decline in the strength of the trend, but it will not be a signal of its change. The signal that indicates the change will be the permanent breaking of the 127.670 level, preferably they shine with a large body and small shadows, and permanently closing the market above this level. The description is just one example of the practical use of momentum in everyday trading. By this method, we can analyze every market in every time period.
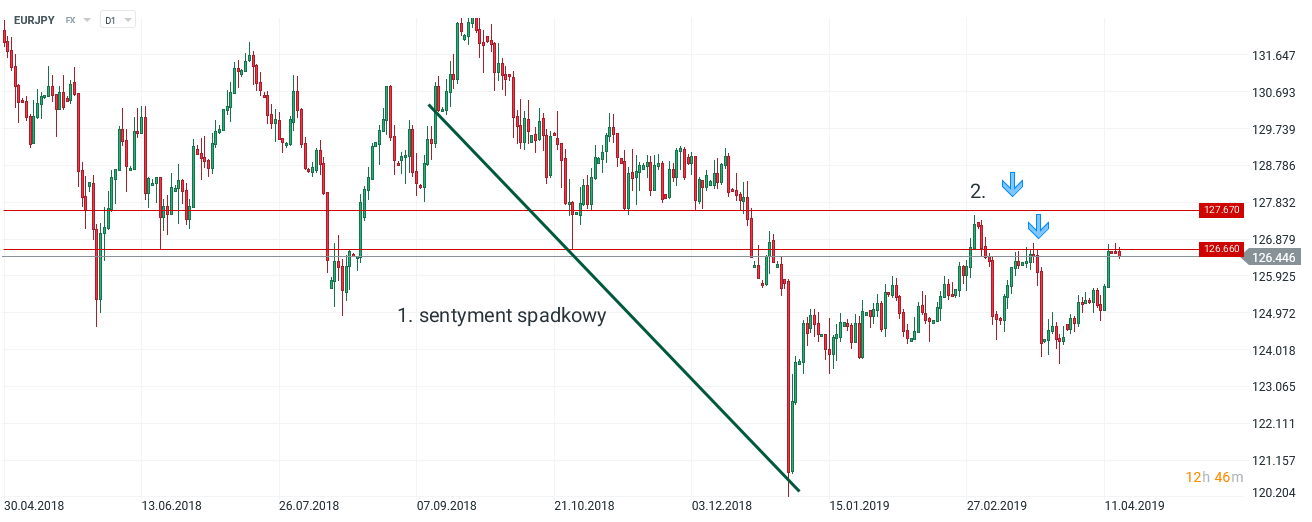
Momentum analysis, EURJPY currency pair, XTB xStation 5
Momentum indicator on the MT4 platform
The MT4 platform also includes an indicator in its tools. It is a typical oscillator that shows us the level of buying / selling out of the market. The indicator measures the price change in the desired period. It can also be helpful when analyzing the strength of the trend in a given market.
The signals flowing from the indicator can be interpreted as follows:
- buy signal: reaching by the local hole index and upward rebound,
- sales signal: reaching the local maximum and downward reflection.
It is also important balance level lineif the indicator raises it from above, we can also read this situation as a signal to sell. The breakthrough from the bottom, we can interpret as a buy signal. As with any indicator, it is also worth paying attention to the divergence, i.e. the discrepancy in the price and ratio behavior.
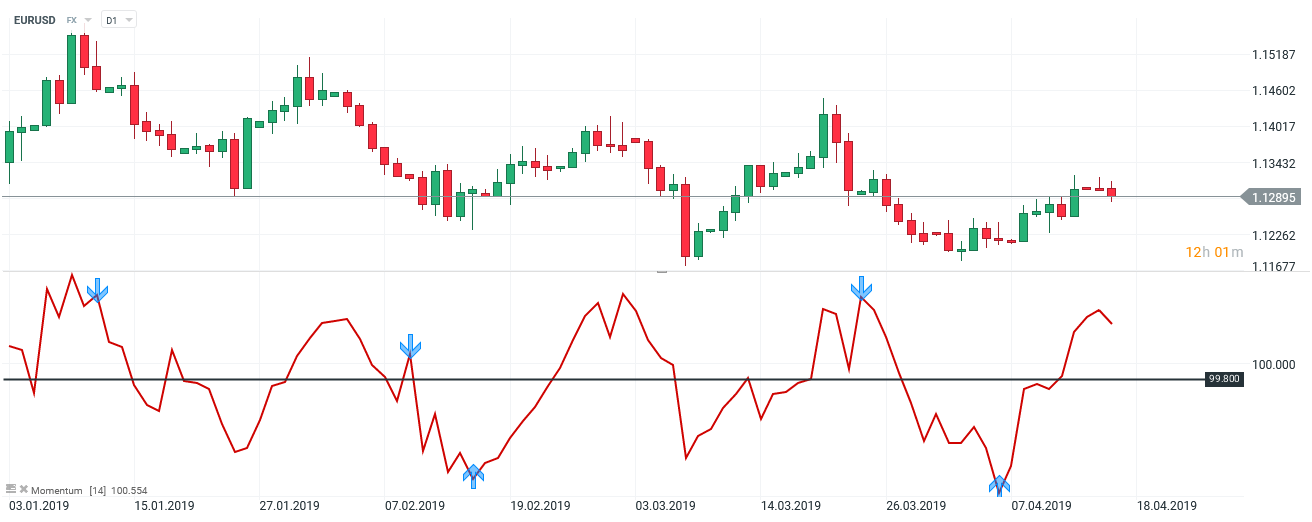
Examples of signals coming from the momentum indicator, currency pair EURUSD, XTB xStation 5


