


A little-known but effective indicator - Waddah Attar Explosion [MT4]

Hardly anyone has heard about the indicator called Waddah Attar Explosion. Maybe because it is not very widely presented in analyzes, webinars or articles. It is not standard on the MetaTrader 4 platform but we can easily find it for download on the web (it is also available for download from our forum here).
Adding Waddah is very simple and just like any other new indicator in MT4 we add the downloaded file to the directory indicators. After adding the file, close and restart the platform in order for the indicator to appear, and you will find it in the indicators tab in the list Own.
Be sure to read: How to add custom tools to MetaTrader 4
We don't have to set anything, we leave the parameters unchanged. It will be easier to change the color of the middle line to a more pronounced one, as below.
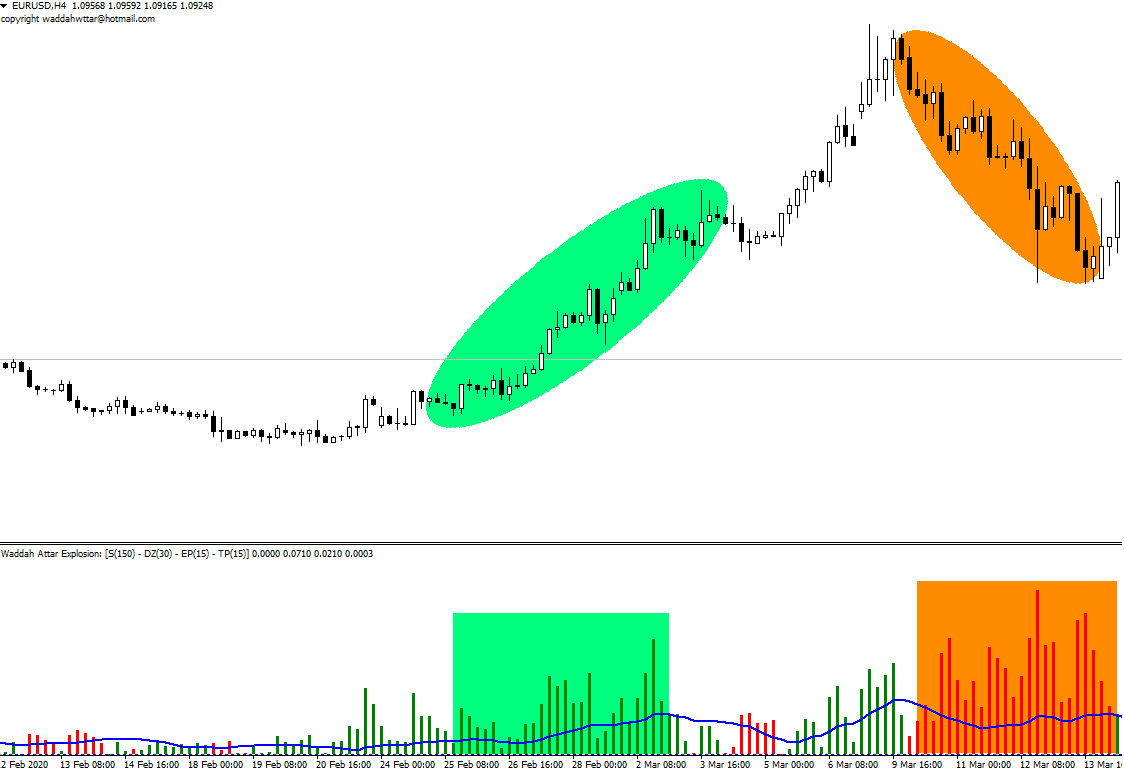
The indicator will be used on all values and time intervals, although on some we can get additional information. Waddah for MT4 is built on a price basis and can easily be used by the trader to determine when the price of a given currency pair or other asset began to move as a move of a continuing trend or correction. In addition, it will show us strong break-outs and key moments when a strong impulse begins and ends. To obtain information about a trend reversal, additional technical analysis tools should be used from a higher time frame (D1, W1) - support and resistance levels or trend lines because the probability of trend reversal is less likely than that the trend will continue.
Operation and signals
Like every indicator, Waddah will also provide us with two signals based on its operation, i.e. entry and exit from the position. Interpreting them is not complicated, because the indicator is transparent and easy to understand.
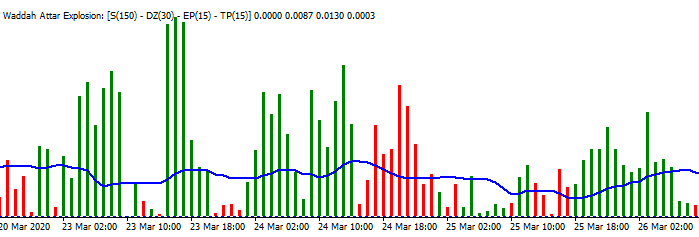
Buy signal will show us a green bar above the blue line running through the center. Exit should be when the green bar is below the blue line. Similarly, we proceed in the case of sales signal looking at the red bars. Large and single bars, both green and red, show us the start of a strong impulse, which will often be information about the beginning trend. It will be particularly useful when breaking levels from consolidation. It is worth doing a preview and analysis at a higher time interval and so, if on the H1 chart we see that the green bar breaks through the blue signal line, then after switching on the H4 interval we will notice that the red bar is already just below the blue line or falls to there found. Thus, we easily obtain an additional and very valuable signal.
Conclusions and final assessment
Summing up the tests and operation of the Waddah Attar Explosion indicator, it can be considered that it is worth our attention and we will certainly have more benefit from it than problems. From the beginning, we won't have any problems interpreting his actions. It well reflects the situation on the chart in the sense that it does not react with a delay. Remember that, like any indicator or oscillator, it can indicate an incorrect or uncertain signal, hence it is always worth comparing it with other indications whether on the chart (candle formations) or using other tools.
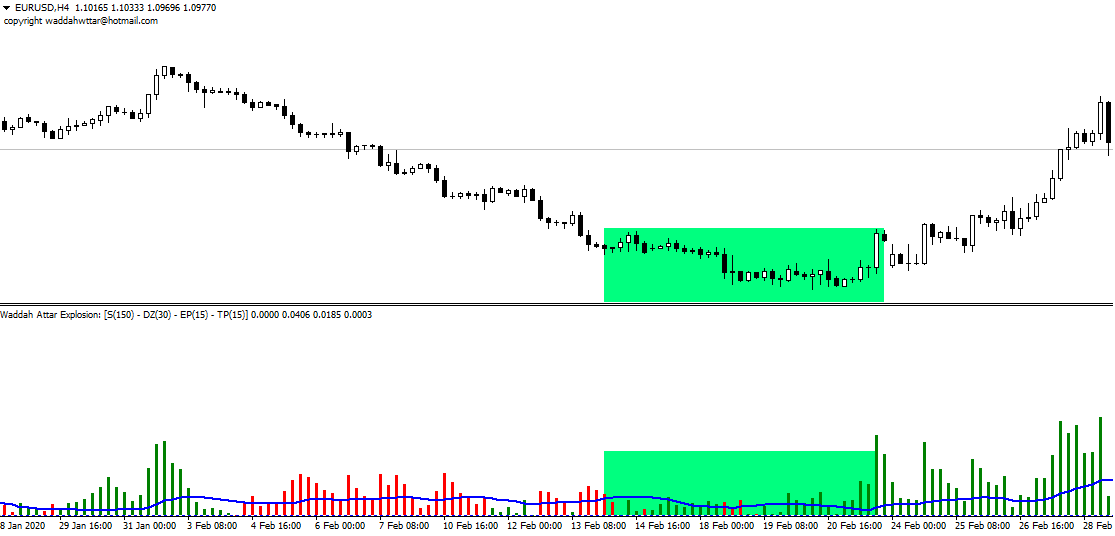
DOWNLOAD - WADDAH ATTAR EXPLOSIONWaddah is least useful in sideways trend, narrow consolidation, then often red and green bars are below the signal line. These are not the best conditions to conclude transactions, and as we already know, the signal for us to take a position is a clear break through the signal line, although it is also information for us about a strong impulse coming.
Advantages:
- Easy to interpret and understand
- Good to indicate the start and end signal of the trend,
- Will work in taking position in the correction of a given pulse - M15 and M30 intervals.
Disadvantages:
- It doesn't quite work well in lateral movement,
- Violently and sometimes incorrectly generates indications from M1 and M5 intervals, especially with high variability,
- You must have additional tools or indicators to complement the signals.


