


MACD - the king of oscillators. How does it work and what does it inform us about?

MACD (Moving Average Convergence/Divergence) is an oscillator that shows the convergence or divergence of the medium-term and long-term moving averages. Typically a 12-period and a 26-period average are chosen for this purpose. The indicator was developed by Gerard Appel as early as 1979. How is it built, is it worth attention, and is the RSI better than it?
What the MACD indicator consists of
The structure of the indicator consists of the MACD line (difference of two moving averages - 12 and 26 period) and the signal line, which is a 9-period moving average.
The indicator window also shows the MACD histogram, i.e. bars oscillating around the zero level. When the short-term average is higher than the long-term average, the bars are above the zero level.
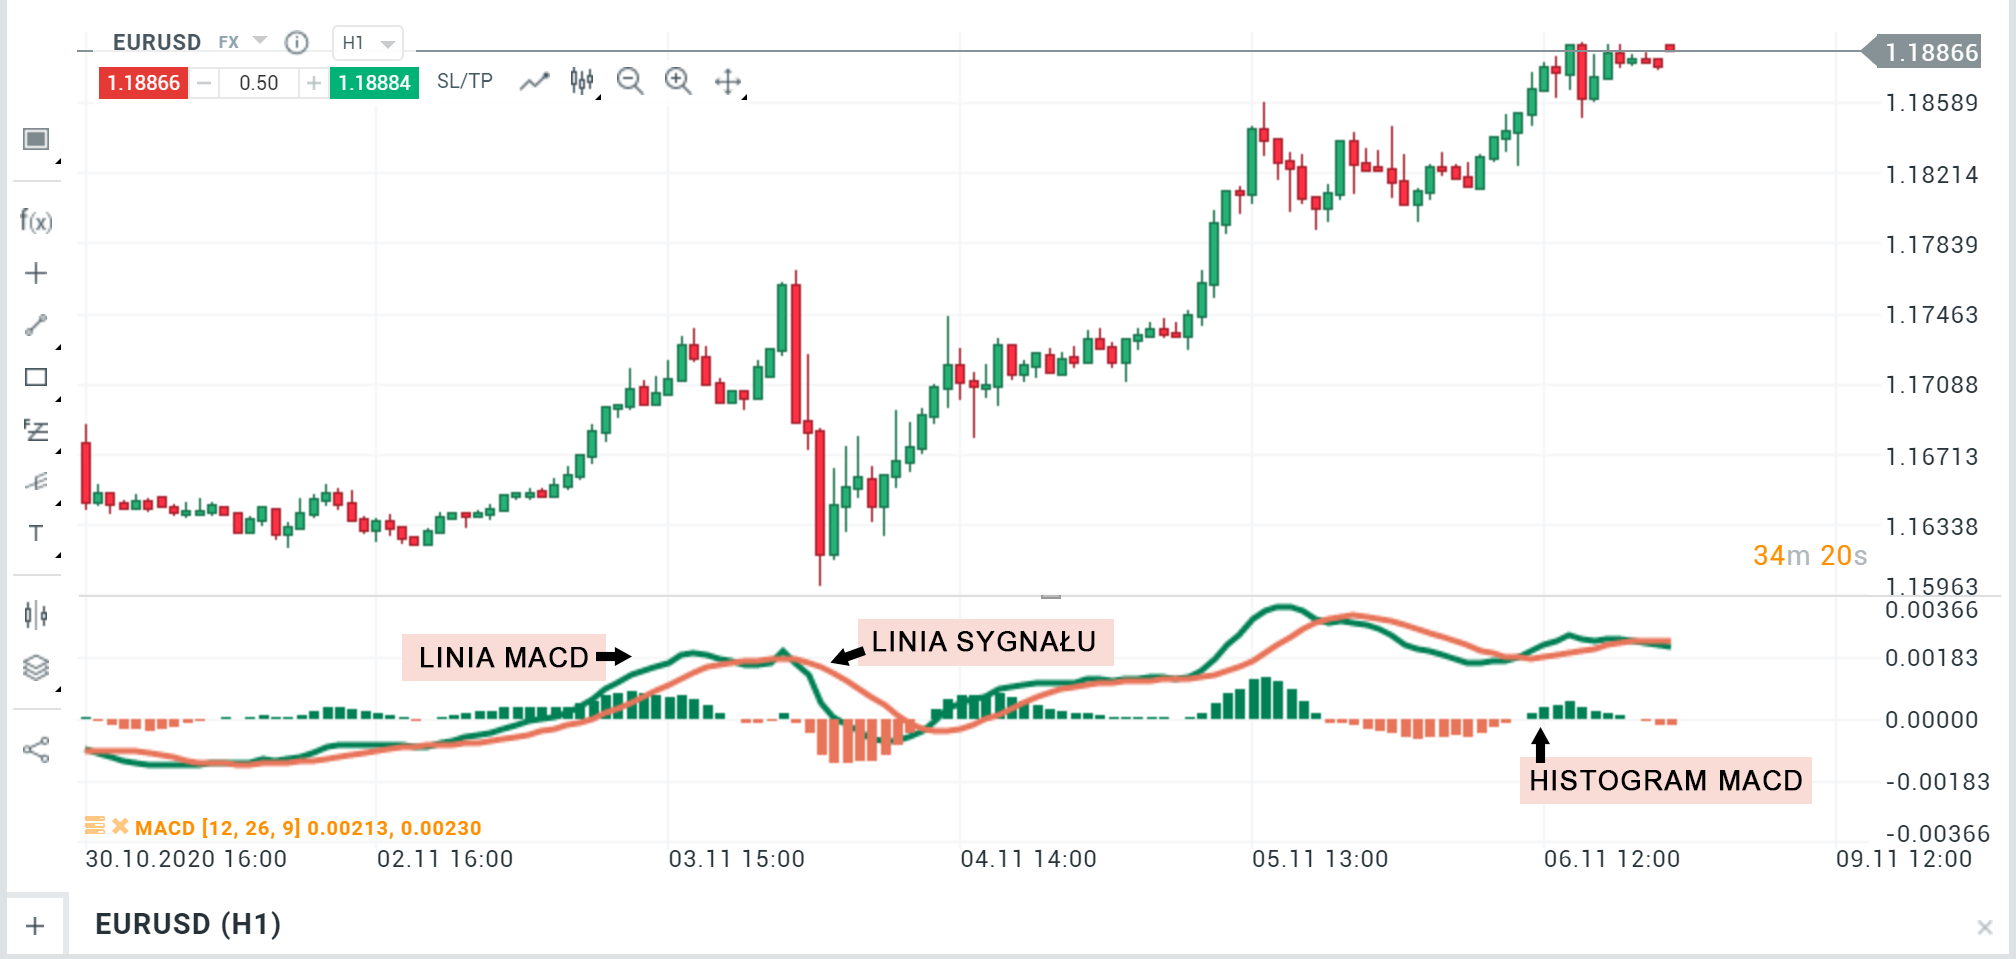
MACD indicator. Source: xNUMX XTB.
On the popular MetaTrader 4 platform, the MACD indicator only has one line (no signal line). In order for the second line to be visible, you need to download a "custom" indicator [DOWNLOAD].
Buy / sell signals
Buy signal
The MACD indicator generates a buy signal when the MACD line crosses the signal line from the bottom. This is an announcement of the upcoming uptrend.
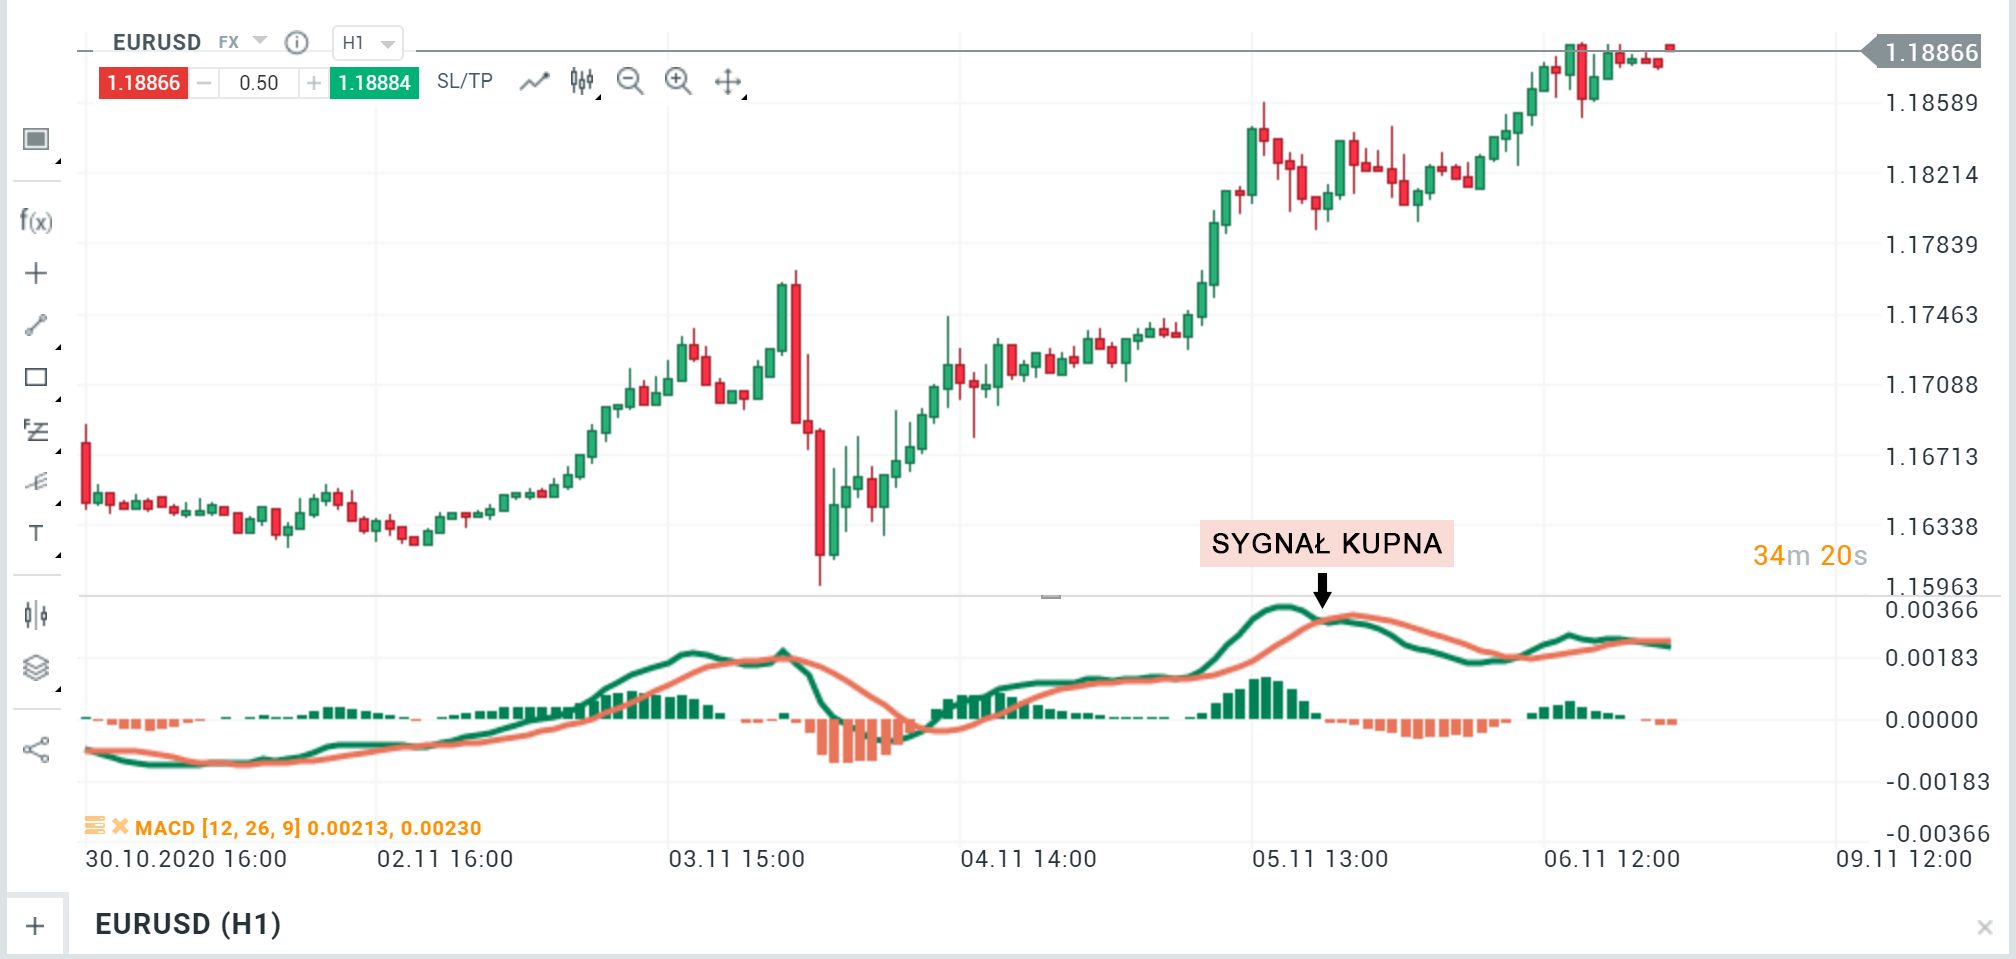
Buy signal. Source: xNUMX XTB.
Sales signal
The sell signal occurs when the MACD line crosses the signal line from the top. This is treated as an announcement of a downtrend.
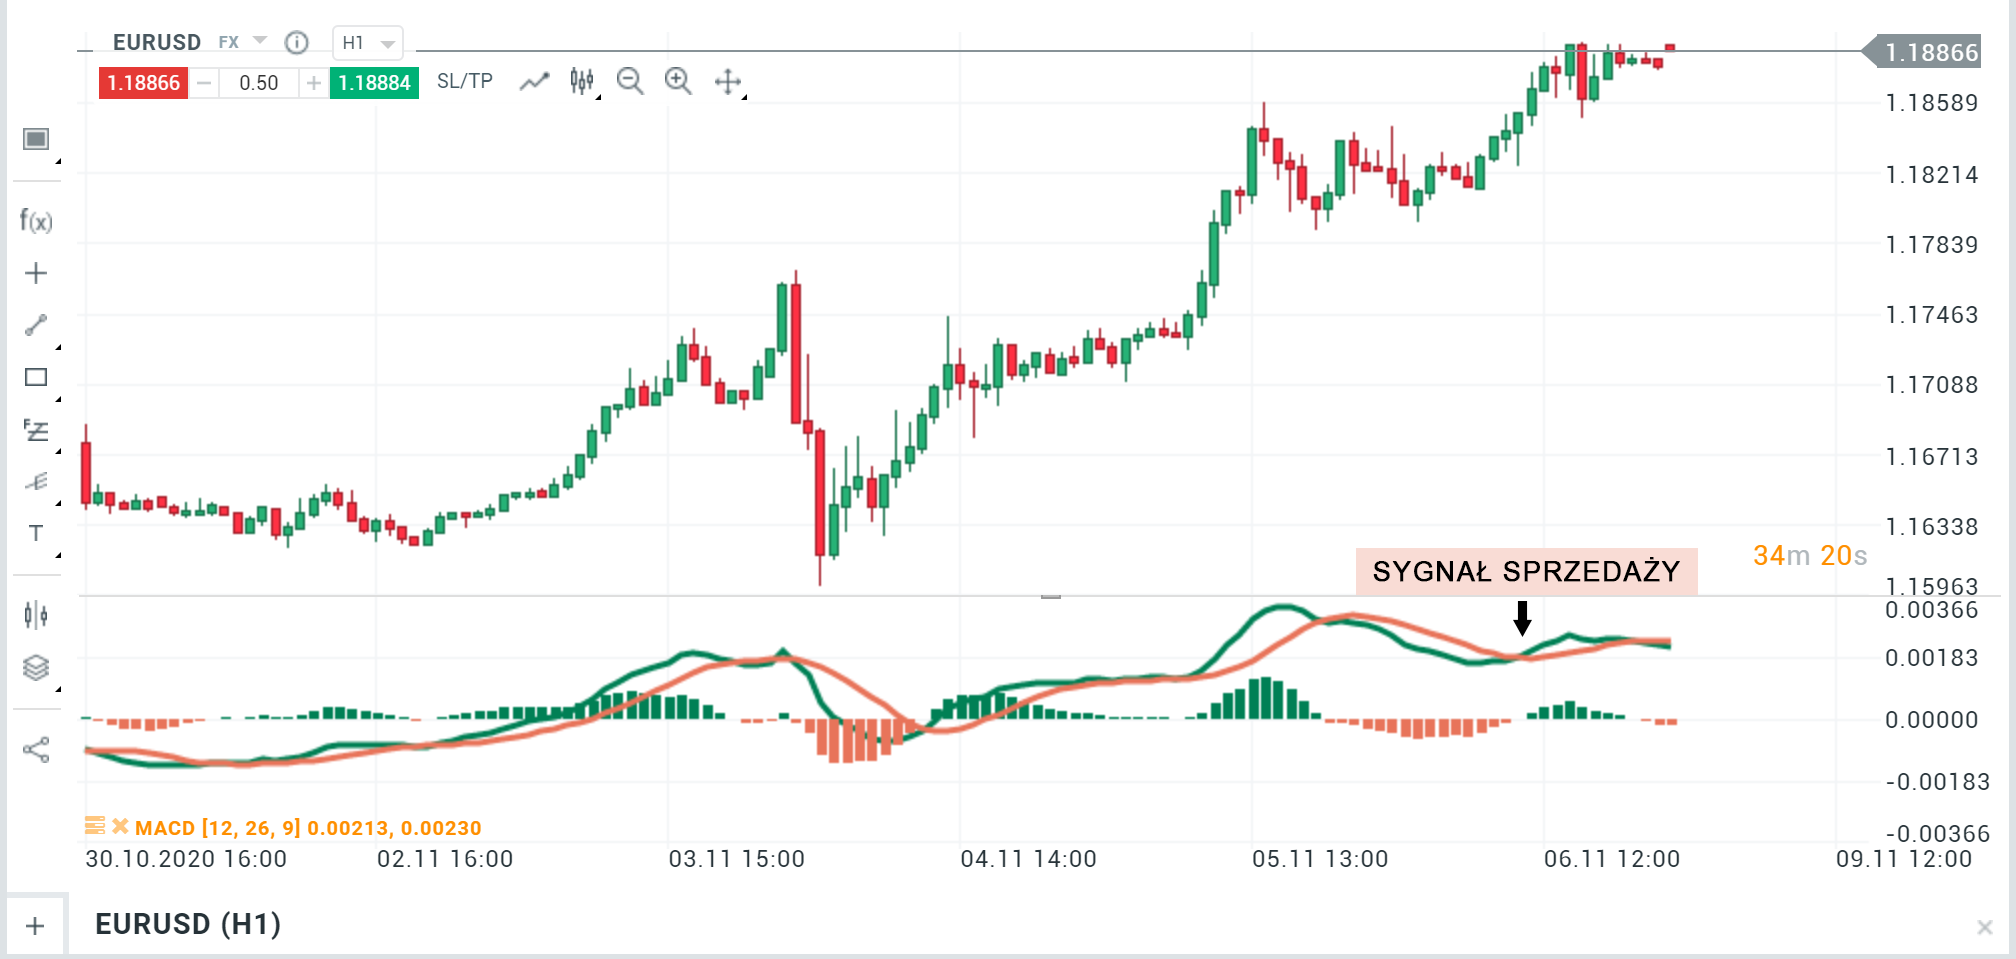
Sale signal. Source: xNUMX XTB.
The formation of a price peak
A situation where the MACD lines are well above the signal line and begin to descend, despite the still rising prices and the formation of successive highs, may herald the depletion of the uptrend and the formation of a peak. This situation is called negative divergence.
Read on and on: What is divergence and how to use it?
The formation of the price bottom
Contrary to the price peak, when the lines are well below the signal line and begin to rise despite the continuation of the downtrend on the chart, this could be a sign of a price bottom forming and an impending trend reversal. This case is called positive divergence.
What is the histogram for?
The histogram can be used as confirmation or inversion of the signal generated by the MACD line and the signal line. If the MACD line crosses the signal line from the bottom, generating a buy signal for us, but the histogram begins to turn downwards, it means that the trend dynamics is not large and the signal accuracy is uncertain
The histogram can also show local highs and lows in places where its direction changes.
Disadvantages of the MACD indicator
It is worth remembering that the title indicator and generally all oscillators do not work well in strong, dynamic trends. When the market is trending, it will generate a lot of false correction signals that can be a source of painful financial lessons. The MACD indicator can be a good advisor when entering a changing trend.
All in all, the MACD indicator is not infallible and will not perform well in strong trends. However, it may prove to be a very helpful tool in assessing the moment of a trend change and the appropriate moment of entry or exit from a position.
MACD and other oscillators
If we decided to use oscillators in our trading, the RSI will definitely be in the crosshairs as well. Is the RSI better than the MACD at anything?
These are very similar indicators. The RSI is a stochastic oscillator of relative market strength based on a given period, typically the last 14 candles. Indicates the momentum and strength of a trend.
If the last 14 candles were up, the RSI would be 100. Many traders interpret this as an overbought signal and a moment to go short. In fact, however, this is a misinterpretation of this indicator. Keeping the oscillator close to the upper extreme value indicates a large momentum of the price and likely further increases and continuation of movement.
Likewise, if the last 14 candles have been bearish, the RSI will be 0. This is mistakenly treated as an oversold signal and a buying opportunity. As in the case of increases, the oscillator at the lower limits of the value indicates a high strength of the downward movement, which will be continued with high probability.
Like the MACD indicator, the RSI can also tell us when the market trend is changing. When the momentum of subsequent price breaks weakens (the oscillator goes down from the highs, below the value of 70 and below), it informs us about a weakening momentum and a probable greater correction or even a trend reversal.
MACD may be more readable for novice investors than RSI, it also leaves less room for self-interpretation (crossing the 0 line is a very objective signal). MACD also gives us a picture of the market in a broader perspective, showing the dynamics of price movement by comparing medium-term and long-term averages (12 and 26 period by default).


