


Wicks of candles - ways to play and use

Wicks, or in other words shadows of candles, are in themselves an interesting concept that can successfully bring profits in everyday investing. However, it is very important to learn how to interpret this type of play. Traditional pin bars have it to themselves that they can be easily detected and often signals which ones flow, they seem obvious. If a wick or long shadow appears in times of a trend, or worse in cases of breaking an important level, it happens that it is misinterpreted by traders, which results in the loss of valuable capital.
In this article, we will try to present a slightly different point of view on candle wicks.
Be sure to read: The most important candle formations
The wick does not have to signal the rejection
One of the most important rules is as follows: wick is not always a signal of rejection. It may be a signal as well breaking the given level by the price. The most common situation of this type is in the case of a candle with a long wick, on the horizontal level of support or resistance. Why is this happening? If the long shadow occurs in the support area, firstly we have a clear indication that the sellers were not strong enough and finally the price did not manage to close below the given level.
The second point of view is quite different. Despite the final breaking and closing above the zone, on there were so many sellers on the market that they managed to push the price down and for a certain period of time it was outside the scope of support. Situations of this type may be so-called "Fakes" that is traps for buyers, and may well indicate a slow change in the balance of power on the chart. Whenever shadow occurs at these levels, it is worth analyzing both scenarios and most importantly, do not go too early.
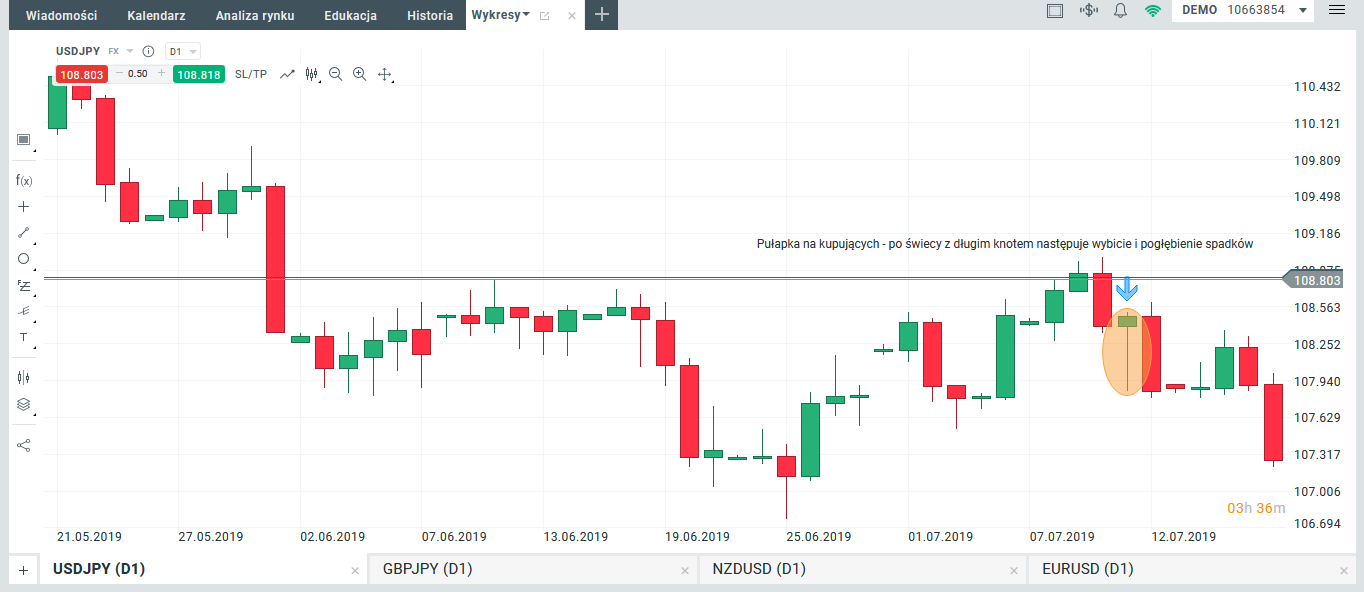
An example of a buyer trap. USD / JPY, D1 interval. Source: xNUMX XTB xStation
Wicks after breaking down support and resistance
Another extremely important aspect in the context "Reading" candles with long wicks are the situation when a given candle appears after breaking the key support level be resistance. It happens that traders see these types of formations leave the position because they are afraid of rejection.
However, it is worth considering why this type of candle appears almost immediately after breaking the zone. Support and resistance are nothing but areas where buyers and sellers are struggling with each other. Pure breakouts can usually only be observed in books and textbooks, and such events are extremely rare on the market. If the price breaks the given level, withdrawal in the direction of breaking is common and really a natural phenomenon. Why is this happening? Most often, orders are set on the levels where the withdrawal takes place stop loss and brake even. We are dealing with classic "catching" orders, and then continuing movement after breaking. The situation of this type can be clearly seen in the example shown. At the outset, we see that the price has broken and permanently closed below the important support from which it has twice reflected in the past. Another candle after declining swing is a classic growth wick. Inexperienced investors seeing this type of situation will immediately come out of their transactions because they will not be able to properly interpret the wick in a given context. Of course, the arrangement of the candle is incrementally set, but one should never forget about the main sentiment prevailing on the market. The earlier candle showed the strength of supply, the breaking of the key zone, the change of strength, and the wick in this case was only aimed at catching buyers' defensive orders.
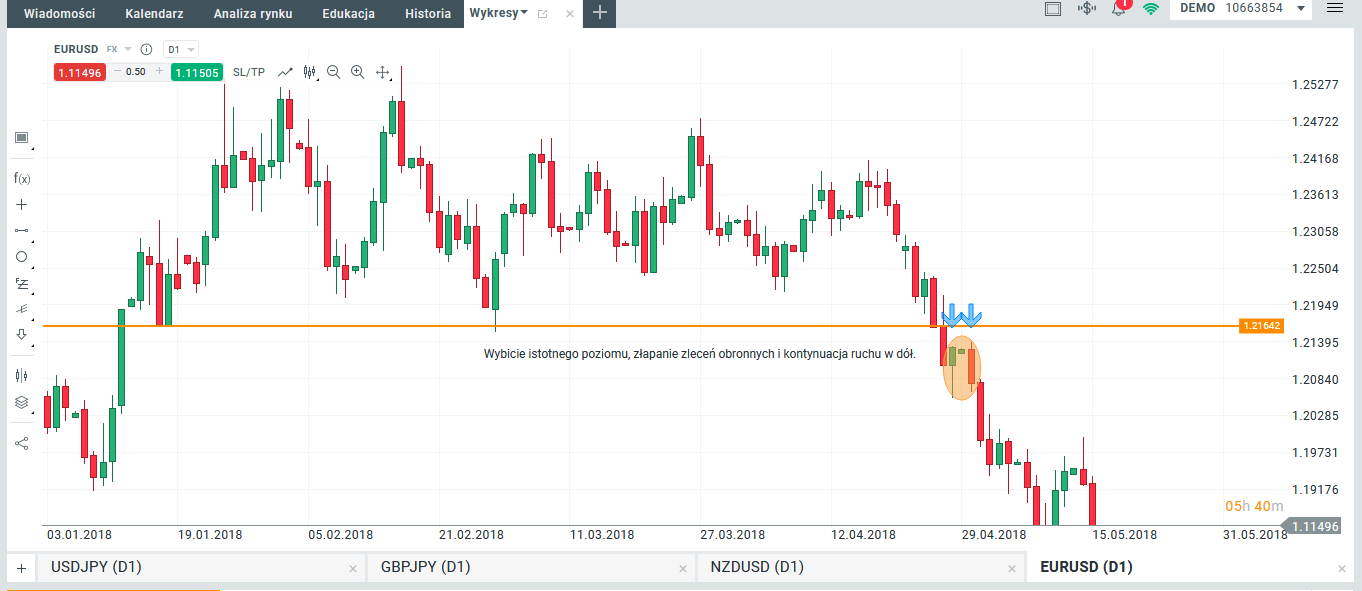
Knot after breaking out important support EURUSD, D1 interval. Source: xNUMX XTB xStation
The last hint when reading this type of play, can be a line graph. Sometimes when the context is not entirely clear, it is worth switching to a different perspective, devoid of unnecessary noise. Analyzing the same example, there were no signs of reversal and upward movement.
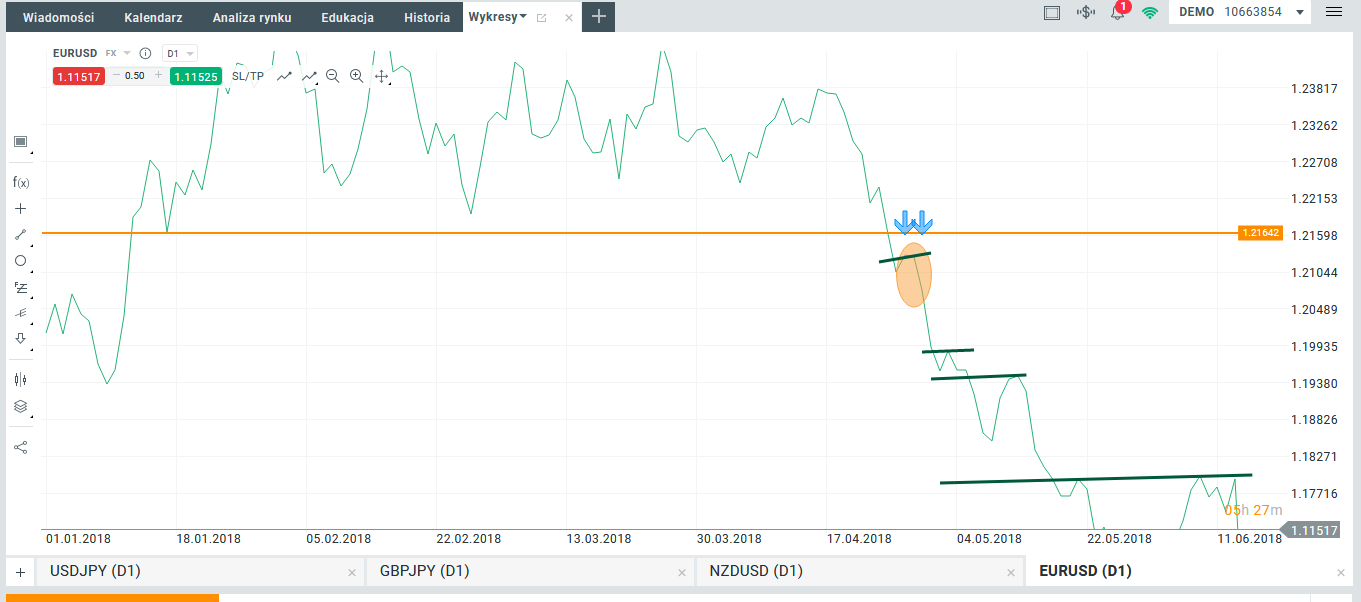
Wick after breaking in a line graph EURUSD, D1 interval. Source: xNUMX XTB xStation


