


Review: Pattern Analysis Widget [Pattern Analysis Widget]

JForex 3 is one of the most dynamically developing trading platforms. Original Swiss project Dukascopy broker It is packed with many innovative features that are designed to provide traders with as many tools as possible to tame the market. One such thing is The Pattern Analysis Tool (PEACOCK - Pattern Analysis Widget).
What is it and is it worth using? We've checked to you. We invite you to read the short review of this tool.
Be sure to read: Review of the JForex 3 trading platform
Pattern Analysis Widget (PAW)
What is the Pattern Analysis Tool? It is a widget that is designed to find and draw technical formations on a chart according to specific parameters. The whole process is automatic. In its assumption, this is primarily to relieve the trader from the tedious search for patterns on the chart, and to avoid some "discretion" when determining them.
It cannot be said that it is an absolute novelty due to the fact that a similar "service" could already be found on such websites as Autochartist or Trading Central. There were also some "copies" of this type of solutions in the form of non-standard indicators. Nevertheless, it is the first tool of this type created by a broker and available as standard on the platform forex. And this is something that deserves praise.
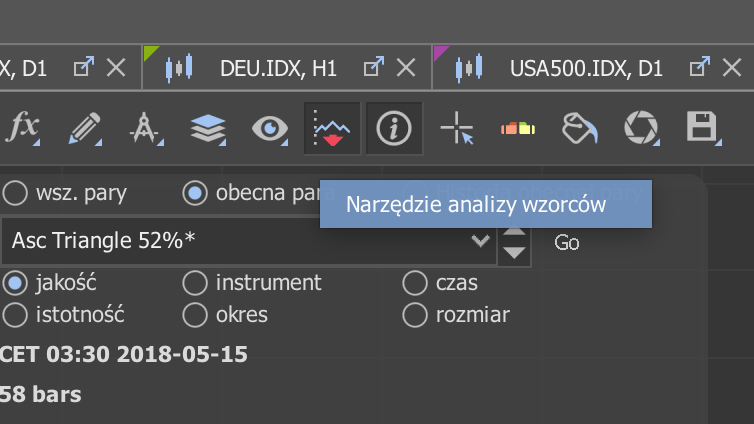
The tool is available on the platform's upper toolbar.
PAW in JForex 3 - functions and possibilities
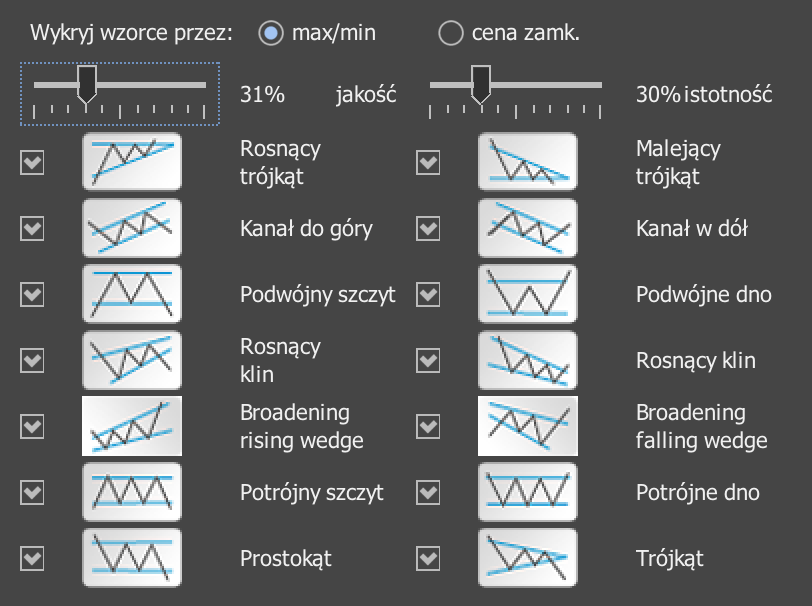
The tool available on JForex 3 finds 14 types of different patterns from the classic technical analysis category. These include triangles, wedges, double tops / bottoms, channels. Of course, it does not have to search for all of them - we can choose only those that interest us. We can also decide on what prices to set - at price lows and highs, or at closing prices. Which solution is better? Decide for yourself.
The PAW may designate structures on all pairs, on the currently selected instrument or in its quote history. The last option is used pro-educational and allows you to assess the correctness of the tool itself. We can check what formations have already been selected and what happened after that.
In addition to receiving a drawn pattern on the plate, we get information about two interesting parameters - quality i significance - which take a value from 0 to 100%. Of course, the closer to 100%, the greater the chance that the formation has been determined with accuracy close to the book's ideal. However, in order not to waste time browsing the "stretch" structures, there is an option of filtering. Thanks to this, we set the threshold ourselves, after which, when exceeded, we will see a diagram on the chart.
It is also possible to sort parameters according to 6, but it works only when more than one diagram is drawn at a time.
Practical application Pattern Analysis Widget
The theory sounds brilliant. We run the tool, the widget searches and draws formations on the chart, after which we only need to make a transaction or set a pending order. But how is it really?
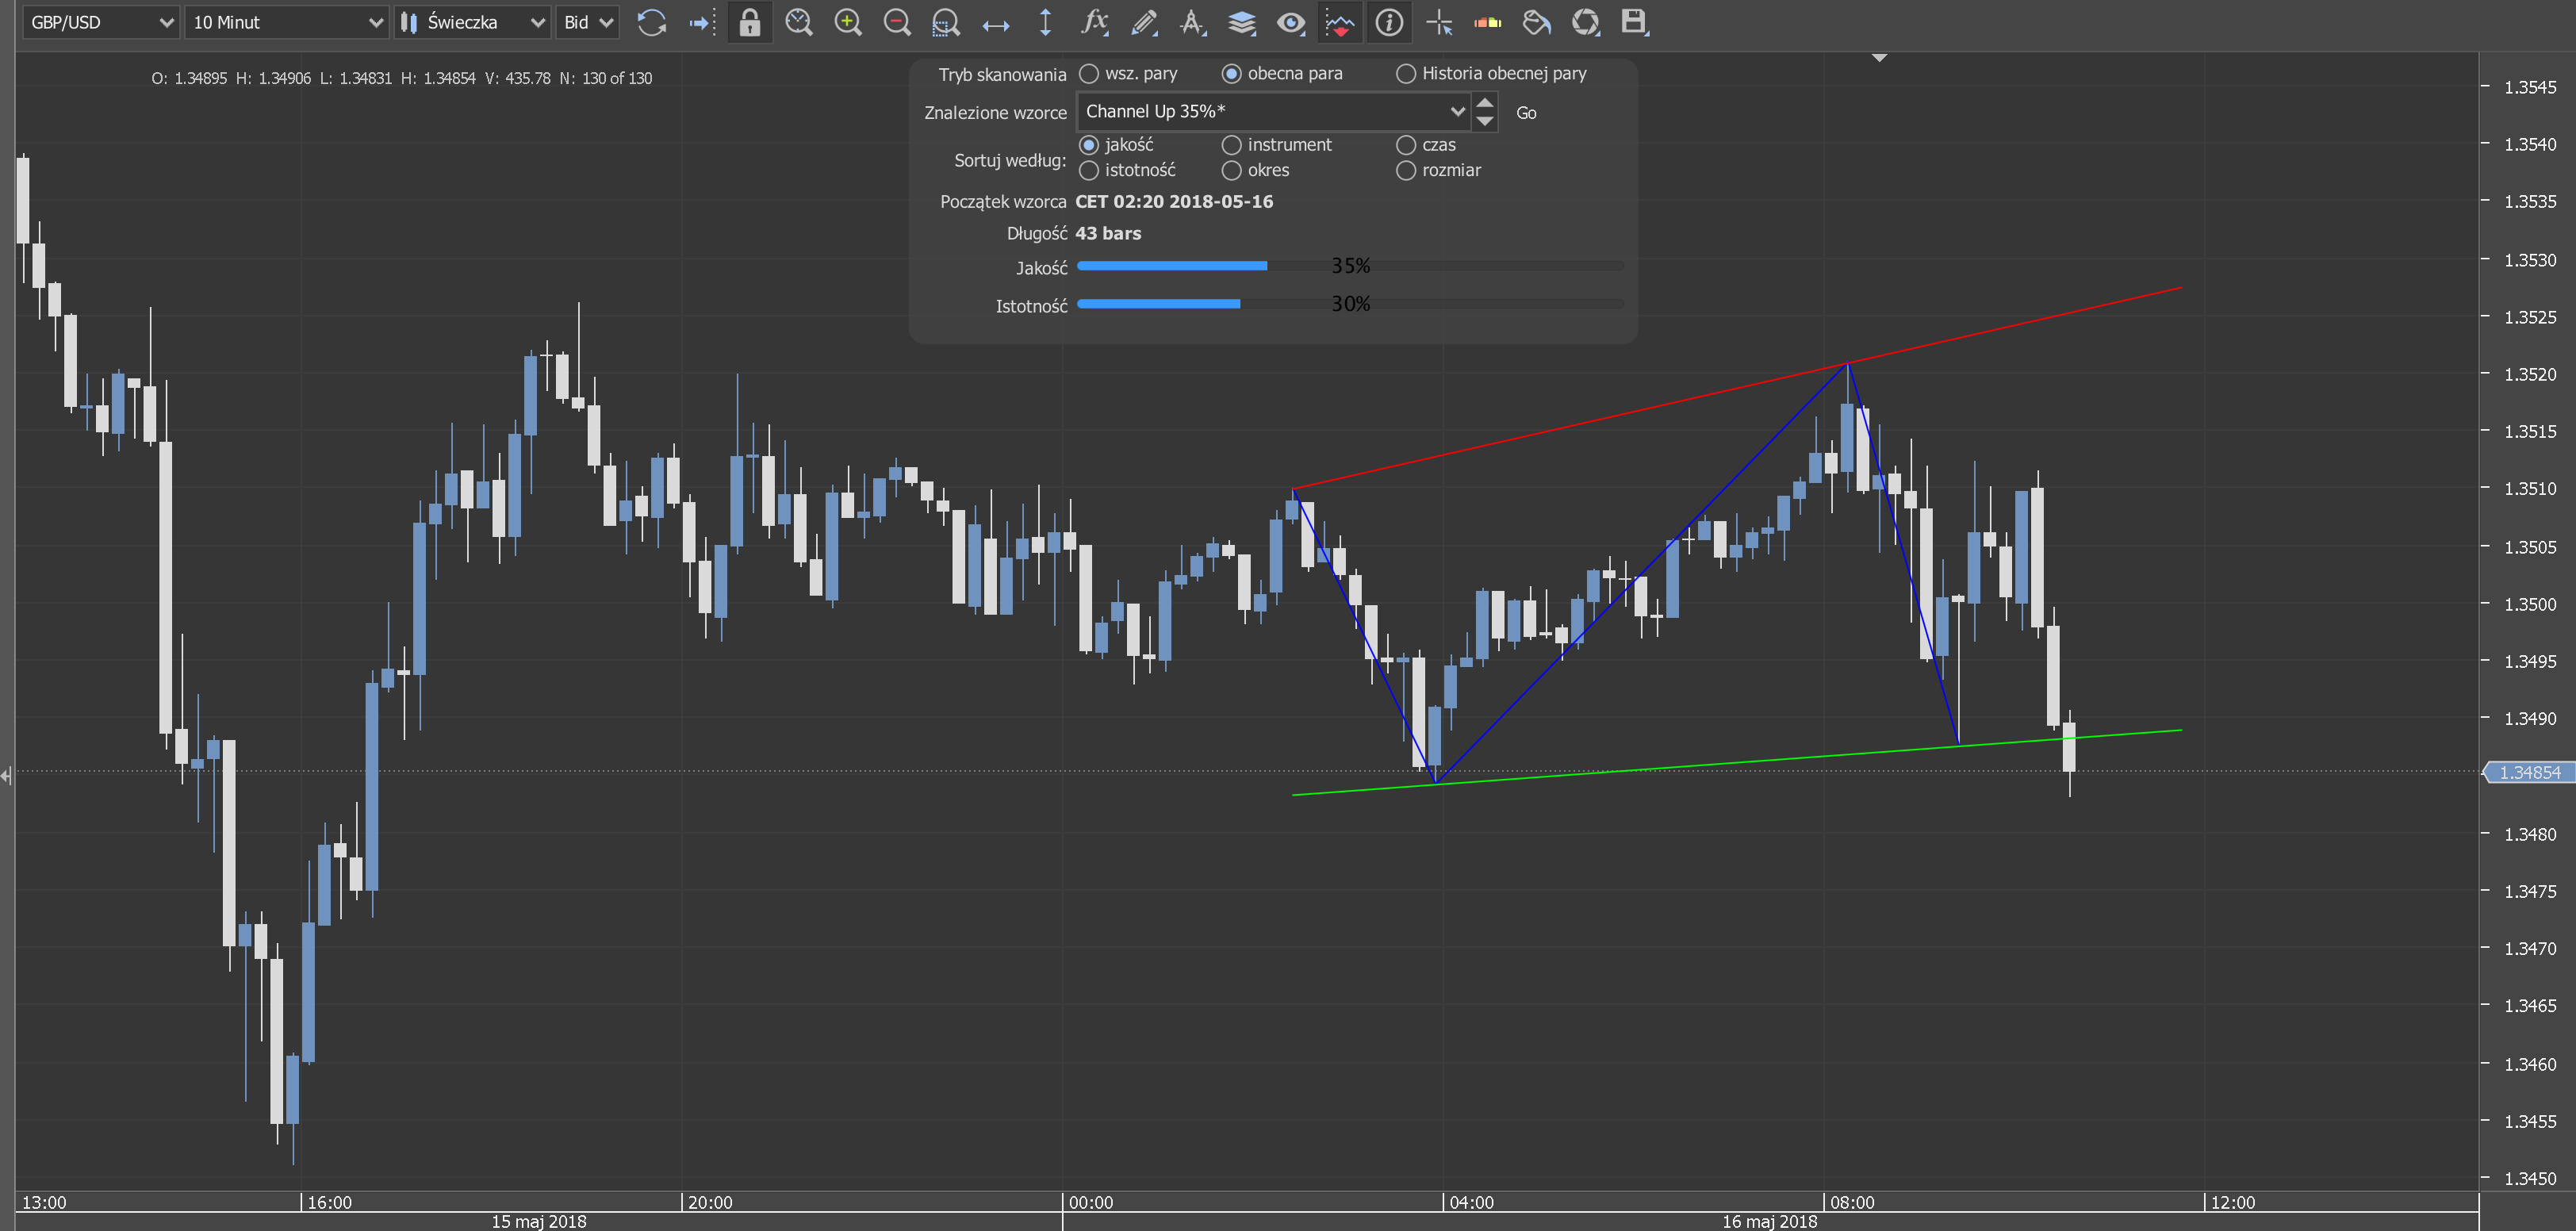
It is no news that practice is not theory. On setting "Current couple" Formations are searched on a regular basis, which means that we can see the outlined pattern on the chart even if it has not been 100% confirmed by the market yet. This occasionally leads to a situation where the drawn pattern may suddenly disappear, despite the fact that, in our opinion, it was drawn well, and even slowly began to work. In order to "disappear" it is enough to change the time interval, and even the settings of the Pattern Analysis Widget itself. This can be annoying.
Another problem is not meeting our expectations. Where the human eye is looking (or wants to spot), for example, a double bottom, the formation is not for the widget. But whether this is not the point to diversify views? 🙂
It happens that the tool draws us two different formations on one segment - for example the formation of a triangle and a right triangle. Each pattern receives its own rating, thanks to which we have a kind of rating ranking for each of them with the option of choosing a structure that will be drawn on the chart.
Very clearly everything is done in option "History of the current couple"where PAW greatly draws formations from the past. You can think "What's so difficult, since we know historical courses?", but for beginner adepts who are just learning to analyze charts, they are certainly useful help in practical education.
Eye vs slot machine - who is winning?
Both the one and the other approach have their significant advantages and disadvantages. Automating any processes always has the task of relieving man and eliminating the risk of human error.
In the case of technical analysis, it has only one significant flaw - it executes a coded command and nothing else. This means that the algorithm is not able to look at the chart in a broader perspective, analyze the place and situation in which the market is. Nor is it able to take into account the macro situation, or introduce a little subjectivity that goes beyond the programmed code.
But on the other hand, is it not our subjectivity and wishful thinking that make the formations set out by themselves stand out from the book patterns and therefore they do not work?
Summation
Pattern Analysis Widget on JForex 3 Dukascopy this is a remarkable tool. Its correctness of operation is not perfect, but it can be assessed as at a decent level. One could find fault with technical shortcomings, such as disappearing diagrams when changing tool settings or refreshing charts, or aesthetic ones, such as some untranslated phrases into Polish.
The key question. Is PAW a way to relieve the technical analyst's duties? Certainly, it will screen out many situations where "nothing" is happening on the market and will bring our eyes to potentially interesting moments. But we still have to be vigilant and check whether too much is filtered out of the chart, and whether the designated patterns have their justification.
Trading for the same PAW recommendations is definitely a bad idea. But as an indicator to search for potential opportunities? With proper knowledge of its advantages and disadvantages, it is an interesting idea to support the analytical process.
Its big advantages are the fact that it is embedded in the transaction platform and a large educational potential for the beginning traders.


