


How to invest in fuel companies? [Guide]

Rising fuel prices at stations may shock some drivers. In Poland, a liter of gasoline costs about PLN 6, but a clear growing tendency is visible practically all over the world. The increase in fuel prices is a derivative of two factors: the increase in oil prices in the world markets, which increases the cost of raw materials, and the weakening of the Polish zloty. The weaker the zloty, the more expensive the import of goods is. Due to the fact that Poland is not rich in this raw material (as opposed to such countries as Venezuela, Russia, Norway or the Persian Gulf countries), it has to import it. Prices on world markets are set in dollars and it is the weakening or strengthening of the zloty that is one of the factors influencing the price at gas stations. Another factor is the refining margin of crude oil processors and taxes (fuel duty, excise duty, VAT, emission fee). In the article we will present what the crude oil sector is and briefly describe selected producers and processors of crude oil.
READ NECESSARY: How to Invest in Oil? [Guide]
Crude oil market is still one of the key sectors in the global economy. The daily demand for crude oil in 2019 was around 100 million barrels. Even in 2020, despite a significant decline in economic activity, the world needed 91 million barrels of crude oil per day. Today, oil drives logistics, communications and the petrochemical sector. The world is dependent on oil for the time being, but it is trying to combat this addiction. The electric car industry is growing rapidly, and concepts for hydrogen-powered cars are also emerging. However, there is no alternative to oil in the coming years.
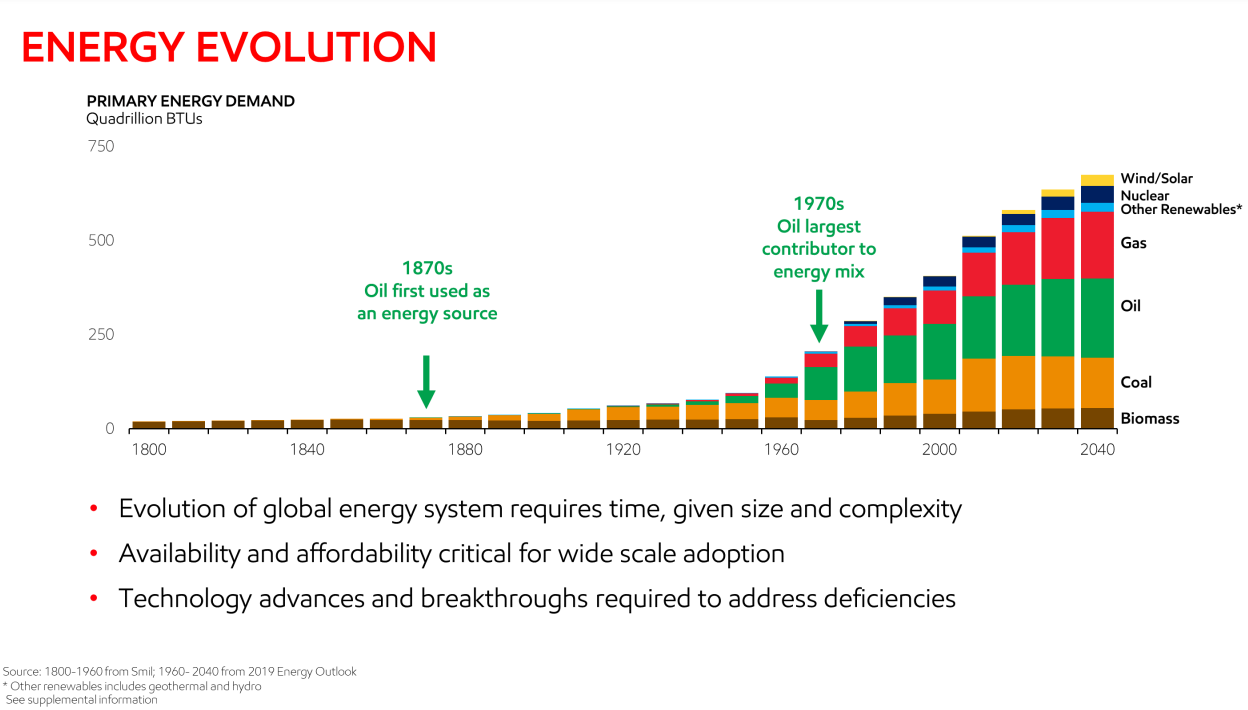
source: ExxonMobil presentation
Crude oil types
Crude oil is divided into individual types that differ in chemical parameters (e.g. sulfur content) and physical parameters (e.g. density). The two most popular types of crude oil that are traded on the stock exchange are WTI and Brent. In addition, there are other types of crude oil, such as the Russian Ural, ORB (OPEC REference Basket) and Dubai Crude.
WTI (West Texas Intermediate) is a crude oil with a lower sulfur content and lower density than Brent crude oil. The WTI Crude Oil futures are traded on the New York Mercantile Exchange (NYMEX). The size of the futures contract was set at 1000 barrels. This means that an increase in the price of the stock exchange by $ 1 corresponds to a change in the face value of the contract by $ 1000.
 Brent is a blend of North Sea oil. It is characterized by a slightly higher density and higher sulfur content (0,37%). Brent crude oil has been traded using futures since the 2005s. Initially, trading took place on the International Petroleum Exchange in London. However, since 1000, trading has taken place on the Intercontinental Exchange. The nominal value of one futures contract was set at XNUMX barrels.
Upstream, midstream and downstream
The process from extraction, through the creation of the finished product and its distribution to the end customer is complicated. The stages can be divided into upstream, midstream and downstream. Very often, the largest companies in the oil industry combine downstream and upstream activities.
Upstream it is an activity related to the exploration of crude oil and its production. Oil companies are benefiting from rising oil prices. This increases the profitability of the investment. When crude oil prices fall, mining companies may have problems with solvency. This is because a smaller income stream may not be sufficient to service your debt. An example is the shale industry in the USA in 2015.
Midstream it is mainly the transport and storage of crude oil to the place of its actual processing. Transportation can be via oil pipeline networks, tankers or rail. This market segment also includes the storage of crude oil. In some countries, the transport segment is managed by state-owned companies. For example, it works in Poland PERN SA (formerly Przedsiębiorstwo Eksploatacji Rurociągów Naftowych Przyjaźń SA). PERN deals with the management of crude oil logistics in Poland (including the Polish section of the “Przyjaźń” crude oil pipeline) and has a storage capacity of 3,5 million cubic meters of crude oil and 1,8 m3 of liquid fuels. These types of companies are also listed on the stock exchange. An example would be Enterprise Product Partners (EPD). The results of enterprises that deal with midstream have fairly stable revenues. This is because the transmission charges are only partially dependent on the price of the raw material.
The final stage is downstream. Companies operating in this sector process crude oil into finished petroleum products (lubricants, fuels, chemicals or asphalt). Oil processing companies benefit from low oil prices.
Seven sisters
The so-called "Supermajors", or BP, Chevron, Eni, ExxonMobil, Total, ConocoPhillips and Royal Dutch Shell. Sometimes these companies are also referred to as Big Oil. The mentioned term together with BigSteel and Big Tech were popularized in the late XNUMXs. The history of supermajors dates back to the XNUMXs when the crude oil market was controlled by the so-called "Seven Sisters". Back then, before the 1973 oil crisis, these companies controlled 85% of the world's oil reserves. However, as the market developed, the share of supermajors decreased. In 2011, Financial TImes coined the phrase "The New Seven Sisters" to which they belong:
- China National Petroleum Corporation (CNPC),
- National Iranian Oil Company,
- petrobrass,
- PDVSA,
- Petronas,
- Saudi Armaco,
- Gazprom.
Investing in crude oil through equities requires the investor to test the company's sensitivity to changes in the price of crude oil. It is worth examining the company's liquidity, revenue structure, product profitability and investment projects (e.g. mining). It should be remembered that fuel companies incur huge capital expenditure and operate on a relatively low operating margin.
Examples of companies from the oil industry
Exxon Mobil
It is the largest American company in the oil sector. The company is the heir of the Standard Oil Company of New Jersey. The separation from Standard Oil was in 1973. In 1999, Exxon merged with Mobil to form ExxonMobil. The company operates in both the downstream and upstream industries. In 2020, ExxonMobil employed 72 employees. Exxon boasts more than 000 billion barrels of proven oil reserves. The company also has over 7 service stations in the United States and in foreign markets. The upstream segment has the greatest impact on the results. In 10, this segment generated over $ 000 billion in net loss. By comparison, the downstream segment lost $ 2020 billion. In turn, sales of chemicals generated about $ 20 billion.
| Exxon | 2017 | 2018 | 2019 | 2020 |
| revenues | $ 237,162 billion | $ 279,332 billion | $ 255,583 billion | $ 178,574 billion |
| operational profit | $ 12,074 billion | $ 22,124 billion | $ 12,766 billion | $ 29,448 billion |
| operating margin | 5,09% | 7,92% | 4,99% | -16,49% |
| net profit | $ 19,710 billion | $ 20,840 billion | $ 14,340 billion | $ 22,440 billion |
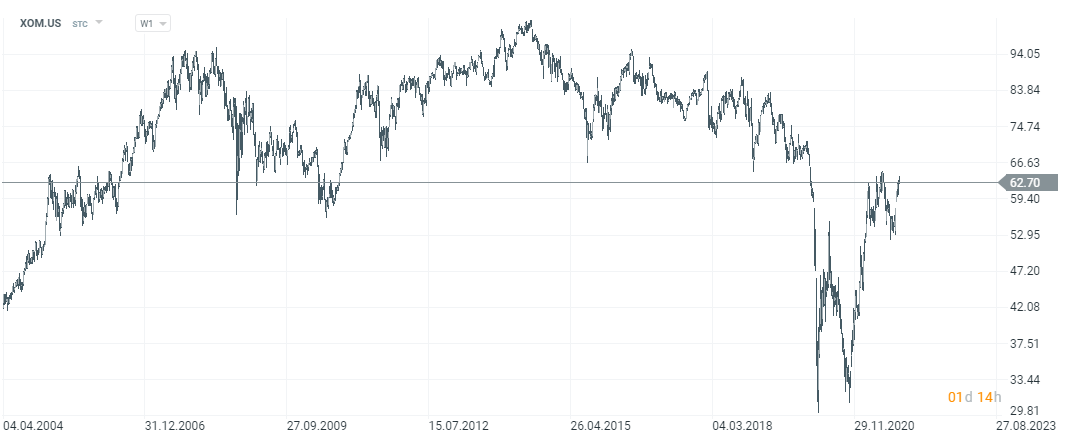
Exxon Mobil stock chart, interval W1. Source: xNUMX XTB.
Chevron
It is the second largest company operating in the US oil sector. In 2020, Chevron was ranked 61st on the Forbes Global 2000 ranking. The company was formed as a result of the Sherman Antitrust Act, which was shared by Standard Oil in 1911. The split resulted in the creation of Standard Oil of California. 1984 brought further changes due to the merger of Standard Oil and Gulf Oil. The name of the company was also changed to Chevron. Like Exxon, Chevron operates in the downstream and upstream markets. It also has midstream activities and has started to enter the new energy market more strongly. In 2020, Chevron generated $ 47 million in downstream profit and posted a loss of $ 2,4 billion on upstream operations.
| Chevron | 2017 | 2018 | 2019 | 2020 |
| revenues | $ 134,674 billion | $ 158,902 billion | $ 139,865 billion | $ 94,471 billion |
| operational profit | $ 2,480 billion | $ 14,446 billion | $ 0,100 billion | $ 6,097 billion |
| operating margin | 1,84% | 9,09% | 0,07% | -6,45% |
| net profit | $ 9,195 billion | $ 14,824 billion | $ 2,924 billion | $ 5,543 billion |
Chevron stock chart, interval W1. Source: xNUMX XTB.
Royal Dutch Shell plc
It is an Anglo-Dutch petrochemical company based in The Hague, Netherlands. RDS was established in 1907 as a result of the merger of the Dutch Royal Dutch Petroleum Company with the British Shell Transport and Trading Limited Company. In 2020, Forbes Global 2000 ranked the company 21st among the largest public companies in the world. Interestingly, in 2013 RDS was ranked first in the Fortune Global 500 ranking. In 2013, the company's revenues exceeded $470 billion, which corresponded to 84% of the GDP of the Netherlands. RDS is a vertically integrated petrochemical company. It operates both in the upstream, midstream and downstream segments. Royal Dutch Shell has operations in over 70 countries. Daily production is equivalent to 3,4 million barrels of crude oil. In 2020, the company had over 87 employees.
| Royal Dutch Shell | 2017 | 2018 | 2019 | 2020 |
| revenues | $ 305,179 billion | $ 388,379 billion | $ 344,877 billion | $ 180,543 billion |
| operational profit | $ 15,481 billion | $ 31,189 billion | $ 22,946 billion | $ 25,530 billion |
| operating margin | 5,07% | 8,03% | 6,65% | -14,14% |
| net profit | $ 12,977 billion | $ 23,352 billion | $ 15,842 billion | $ 21,680 billion |
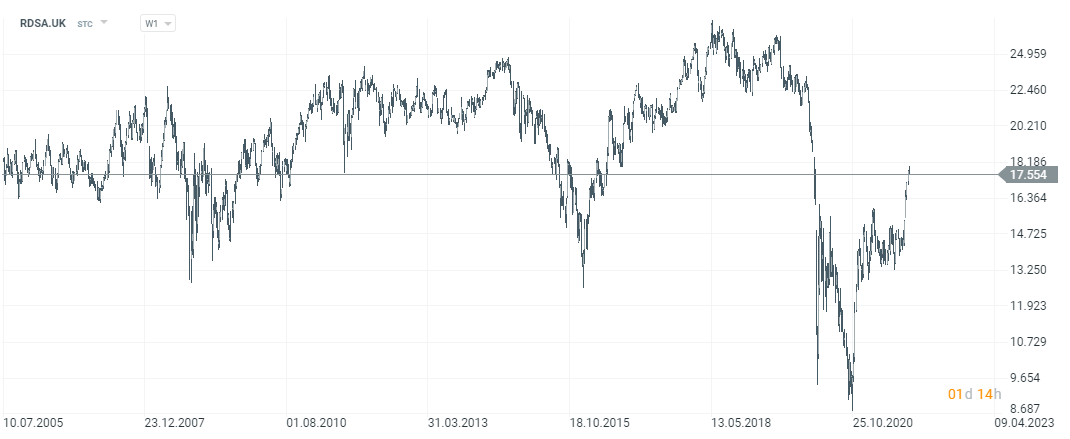
Shell stock chart, interval W1. Source: xNUMX XTB.
Petrochina
It is a state-owned Chinese company that explores, extracts, transports and processes crude oil. Like most mining companies, it also produces natural gas. In 2019, the company was the largest oil and gas producer in Asia. The company was founded in 1999 as part of the restructuring of the state-owned CNPC. It is worth mentioning that Petrokhina has one of the largest pipeline networks in the world. At the end of 2020, the Chinese company had 22,5 thousand. kilometers of gas pipelines, 7,2 thous. oil pipelines and over 1,4 thousand. pipelines for the transport of refined products. Petroochina is also a component of the SSE 50 Index. The company is also listed in the United States. Petrokhin's capitalization exceeds $ 150 billion.
| Petrochina | 2017 | 2018 | 2019 | 2020 |
| revenues | CNY 2 billion | CNY 2 billion | CNY 2 billion | CNY 1 billion |
| operational profit | CNY 62,3 billion | CNY 115,3 billion | CNY 116,2 billion | CNY 70,8 billion |
| operating margin | 3,09% | 4,90% | 4,62% | 3,66% |
| net profit | CNY 22,8 billion | CNY 52,6 billion | CNY 45,7 billion | CNY 19,0 billion |
PKN Orlen
It is a Polish fuel and energy concern listed on the Warsaw Stock Exchange. It is also one of the largest companies of this type in Central and Eastern Europe. Orlen has refineries in Poland, the Czech Republic and Lithuania. Their total processing capacity in 2020 was 36 million tonnes per year. Orlen has little hydrocarbon extraction activity. In 2020, production amounted to 16,2 thousand tonnes. barrels of crude oil equivalents per day. Orlen has a very extensive retail network. It has over 2500 petrol stations on 5 markets. The company is also developing an offer for owners of electric cars. The company has over 110 electric car fast charging stations. Orlen also has an energy branch that produces over 3,9 GW of electricity. PKN also took over the Ruch kiosk network and has a media branch, in 2020 Polska Press took over (the owner of such newspapers as Dziennik Bałtycki, Kurier Lubelski or Głos Wielkopolski). The acquisition of Lotos by Orlen is still in the preparation phase. The company's capitalization is currently around PLN 37 billion.
| orlen | 2017 | 2018 | 2019 | 2020 |
| revenues | PLN 95,364 billion | PLN 109,706 billion | PLN 111,203 billion | PLN 86,180 billion |
| operational profit | PLN 8,580 billion | PLN 6,441 billion | PLN 5,713 billion | PLN 0,021 billion |
| operating margin | 8,99% | 5,87% | 5,14% | 0,02% |
| net profit | PLN 6,655 billion | PLN 5,556 billion | PLN 4,300 billion | PLN 2,755 billion |
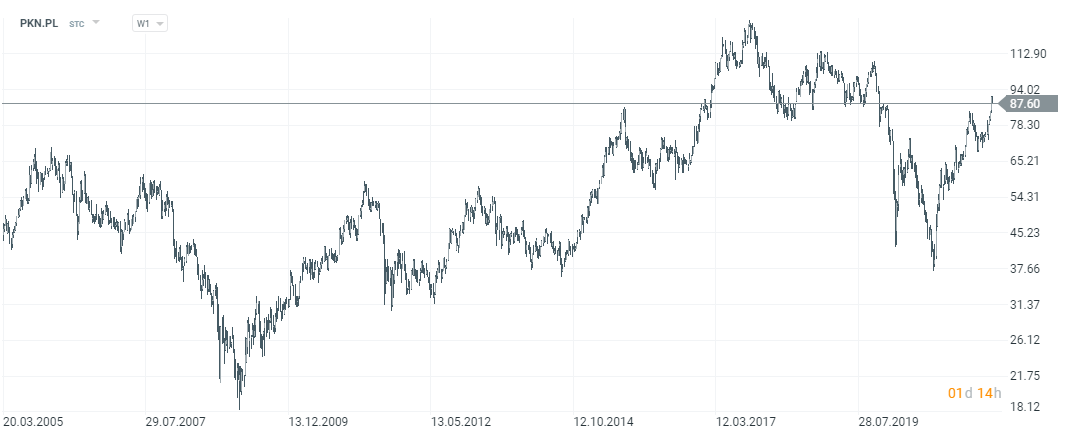
Orlen stock chart, interval W1. Source: xNUMX XTB.
Lotos
It is the second largest oil refinery in Poland. Its origins go back to the Polish People's Republic. The company was founded in 1972 as the Gdańsk Refinery. The first production started in December 1975 (petrol, diesel). Five years later, asphalt production began. Until today, the main activity of the company is downstream and upstream. Lotos daily extracts over 20 thousand. barrels of oil equivalent. Currently, the majority shareholder of the company is the Polish State Treasury, which holds over 53% of shares. At the beginning of 2018, the process of merging PKN Orlen with Lotos began. The European Commission has agreed to the takeover on condition that the fuel stations owned by Lotos are sold and a 30% stake in the Lotos refinery. The current capitalization of the company exceeds PLN 11 billion.
| Lotos | 2017 | 2018 | 2019 | 2020 |
| revenues | PLN 24,186 billion | PLN 30,122 billion | PLN 29,493 billion | PLN 20,909 billion |
| operational profit | PLN 2,332 billion | PLN 2,614 billion | PLN 1,982 billion | -0,446 billion PLN |
| operating margin | 9,64% | 8,68% | 6,72% | -2,13% |
| net profit | PLN 1,672 billion | PLN 1,587 billion | PLN 1,153 billion | -1,146 billion PLN |
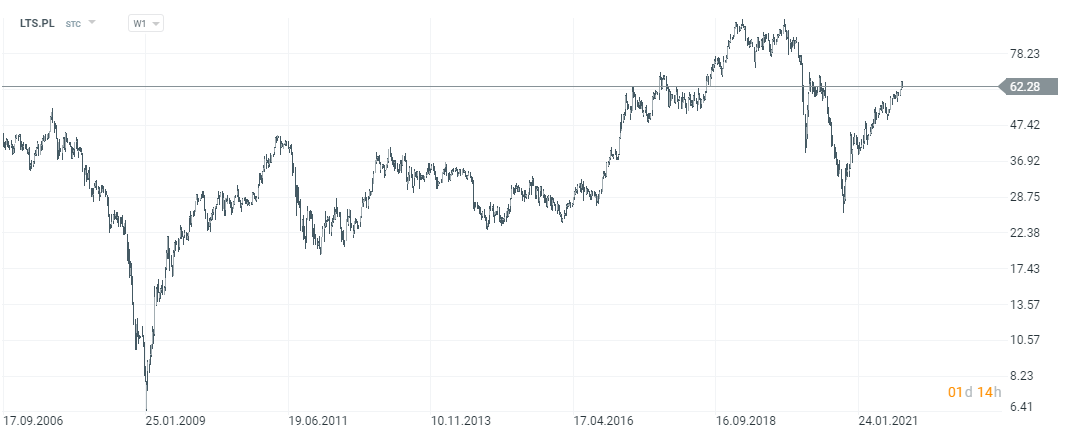
Lotos stock chart, interval W1. Source: xNUMX XTB.
BP plc
British Petroleum is one of the famous "supermajors". It is a vertically integrated oil company. It deals with the exploration, extraction, transport and processing of hydrocarbons. It is worth noting that BP, through its subsidiary BO Russian Investments Limited, owns 19,75% of shares in Russia's Rosneft (the largest oil producer in Russia). BP is one of the components FTSE 100 index. It is also listed on the Frankfurt and New York stock exchanges. In 2020, BP was 357 on the Forbes Global 2000 list. It is worth mentioning that last year the company produced 1,99 million barrels of crude oil and 7,9 billion cubic feet of natural gas per day. The company's capitalization exceeds $ 97 billion.
| BP | 2017 | 2018 | 2019 | 2020 |
| revenues | $ 240,208 billion | $ 298,756 billion | $ 278,397 billion | $ 180,366 billion |
| operational profit | $ 7,919 billion | $ 16,341 billion | $ 16,193 billion | $ 0,573 billion |
| operating margin | 3,30% | 5,47% | 5,82% | -0,31% |
| net profit | $ 3,388 billion | $ 9,382 billion | $ 4,025 billion | $ 20,306 billion |
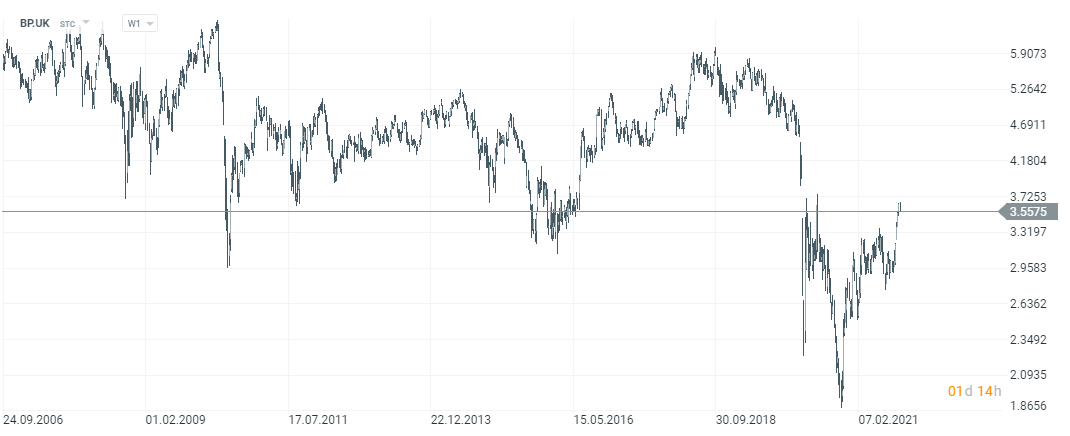
BP stock chart, interval W1. Source: xNUMX XTB.
Investing in the fuel sector
Exposure to the crude oil market can be obtained not only by purchasing shares of individual companies or crude oil contracts. This can also be done through an acquisition ETFwhich is related either to the raw material itself or to the broadly understood oil industry. One of the most popular ETFs giving exposure to the oil industry is XOP (SPDR S&P Oil & Gas Exploration & Production). The ETF has approximately $ 4,5 billion in assets under management. Its annual management costs are 0,35% per annum. The benchmark for the fund is S&P Oil & Gas Exploration & Production Select Industry. ETF's portfolio includes such companies as ConocoPhillips, Chevron and Callon Petroleum.
ETC (Exchange Traded Commodity) can also be purchased, which are designed to mimic the behavior of the oil price. An example would be WisdomTree WTI Crud Oil (CRUD)which is to reflect the changes in the WTI crude oil price. The annual ETC management cost is 0,49%, plus the daily swap cost of 0,001233%.
You can also invest in the largest companies operating on the oil processing market. An example is the very popular ETF called Energy Select Sector SPDR Fund, whose AUM (XLE) - assets under management amount to $ 27,8 billion. The benchmark for the ETF is the S&P Energy Selected Sector Index. The annual management fee is 0,12%. The largest components of the ETF are Exxon (22,0%) and Chevron (19,5%).
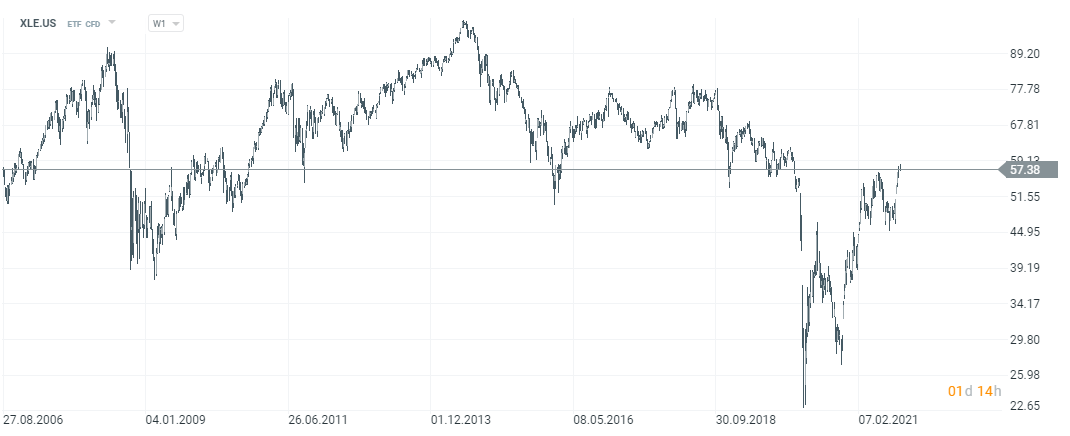
ETF Energy Select Sector SPDR Fund (XLE) CFD Chart, Interval W1. Source: xNUMX XTB.
Fuel companies - where to invest in stocks and ETFs
An increasing number of forex brokers have quite a rich offer of stocks, ETFs and CFDs for these instruments.
For example on XTB Today, we can find over 3500 equity instruments and 400 ETFs, a Saxo Bank over 19 companies and 000 ETF funds.
| Broker |  |
||
| End | Poland | Denmark | Cyprus * |
| Number of exchanges on offer | 16 exchanges | 37 exchanges | 24 exchanges |
| Number of shares in the offer | approx. 3500 - shares circa 2000 - CFDs on shares |
19 - shares 8 - CFDs on shares |
approx. 3 - CFD on shares |
| The amount of ETF on offer | approx. 400 - ETF approx. 170 - CFD on ETF |
3000 - ETF 675 - CFD on ETF |
approx. 100 - CFD on ETF |
| Commission | 0% commission up to EUR 100 turnover / month | according to the price list | Spread depends on the instrument |
| Min. Deposit | PLN 0 (recommended min. PLN 2000 or USD 500, EUR) |
0 PLN / 0 EUR / 0 USD | PLN 500 |
| Platform | xStation | SaxoTrader Pro Saxo Trader Go |
Plus500 platform |
* PLUS500 CY offer
CFDs are complex instruments and come with a high risk of losing money rapidly due to leverage. From 72% to 89% of retail investor accounts record monetary losses as a result of trading CFDs. Think about whether you understand how CFDs work and whether you can afford the high risk of losing your money.


