


How to trade the Nasdaq Composite Index? [Guide]

Nasdaq Composite is one of the most famous indices to which a "patch" has been attached technology companies barometer. It is worth mentioning that the index is weighted by capitalization, so it is calculated quite differently than Dow Jones Industrial Average 30 (DJIA 30). The index is included more than 3300 companies. So it is a very broad index that has exposure across multiple sectors. It should also be added that the Nasdaq Composite index may include companies that are listed exclusively on The Nasdaq Stock Market or are listed on the Nasdaq and other American stock exchanges.
A component of the index may be a company which is:
- An American joint stock company,
- REIT,
- A foreign company listed through ADRs.
In turn, the index cannot include:
- ETFs,
- Stock exchange-listed funds,
- Warrants and other derivatives,
- Preference shares,
- Bonds converted into shares.
The Nasdaq Composite is one of the best-known indices that provide exposure to US technology companies. However, it's important to remember that tech companies make up about half of the index. On the other hand, the components of the index also include companies operating in the "old economy". You can find producers of sweets, the owner of a cafe chain or a well-known beverage producer. It is also worth remembering that the Nasdaq Composite index also includes foreign companies (including Chinese companies JD.com or Pinduoduo). As with most indices, the Nasdaq Composite is capitalization weighted.
Index history

Pets.com mascot - one of the companies - dotcom bubble symbols
The history of the index dates back to February 5, 1971. The base value of the index was set at 100 points. During the first year, the index grew and reached the level of 130 points. However, the index very quickly fell into a bear market caused by the crisis of 1973-1974, which was the aftermath of the collapse of the Bretton Woods system (the so-called Nixon Shock). At its peak, the Nasdaq Composite fell below 55 points (October 1974). The index broke the 1972 peak only in September 1978. For the next 9 years, a strong bull market continued, which was interrupted by the 1987 crash. Another strong bull market lasted from 1989 to 2000. The period from 1995 to 2000, also known as the dotcom bubble, was particularly dynamic. During this period, the Nasdaq Composite index increased from 1000 points to 5 points (March 046, 9).
After the Internet bubble burst, Nasdaq fell into a two-year slump that ended in October 2002. It wasn't until 2015 that the Nasdaq set another summit. On August 24, 2021, the index exceeded the level of 15 points.
Index composition
According to data provided by Nasdaq Inc, the Nasdaq Composite index had 2021 components at the end of the second quarter of 3334.
The largest shares are held by companies from the following industries:
- IT - 47,97%,
- discretionary goods - 20,28%,
- healthcare - 10,31%,
- industry - 6,33%,
- finance - 4,81%.
The largest components of the index are the following companies:
Below is a brief overview of several of the companies in the Nasdaq Composite Index.
JD.com
It is one of the largest sales platforms in China. Unlike Alibaba, it develops its own logistics network, which allows you to deliver products faster and control the entire customer experience (from placing an order to receiving it). The company has over 1200 warehouses all over China. The company employs over 200 people in logistics (couriers and warehouse workers). JD is very strong in selling electronics and home products. The company diversifies its activities by entering, among others, the cloud sector. Large expenditure on logistics means that the company incurs very large capital expenditure (CAPEX).
|
million RMB |
2017 |
2018 |
2019 |
2020 |
|
revenues |
362 332 |
462 020 |
576 888 |
745 802 |
|
operational profit |
8 |
-1 982 |
7 332 |
13 238 |
|
operating margin |
0,00% |
-0,43% |
+ 1,27 % |
+ 1,77 % |
|
net profit |
-152 |
-2 492 |
12 184 |
49 248 |
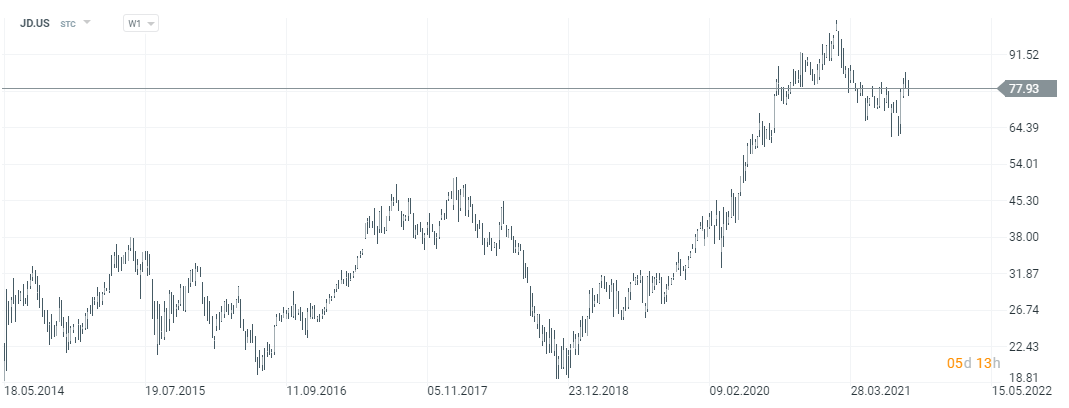
JD.com stock chart, interval W1. Source: xNUMX XTB.
Booking.com
The company was founded in 1997. It is one of the few stars of the turn of the 96th and XNUMXst centuries to have emerged unscathed from the burst of the Internet bubble. Booking is best known for providing hotel reservation services over the internet (via a website or smartphone app). Via Rentalcars.com, it also offers online car rental. The Booking Holdings group also includes the KAYAK service, which allows you to compare the prices of airline tickets, hotel rooms and car rentals. Through the OpenTable brand, the company also offers restaurant reservations. Currently, the company's capitalization exceeds $ XNUMX billion.
| $ million | 2017 | 2018 | 2019 | 2020 |
| revenues | 12 681 | 14 527 | 15 066 | 6 796 |
| operational profit | 4 543 | 5 341 | 5 345 | 580 |
| operating margin | 35,83% | 36,77% | 35,48% | 8,53% |
| net profit | 2 341 | 3 998 | 4 865 | 59 |
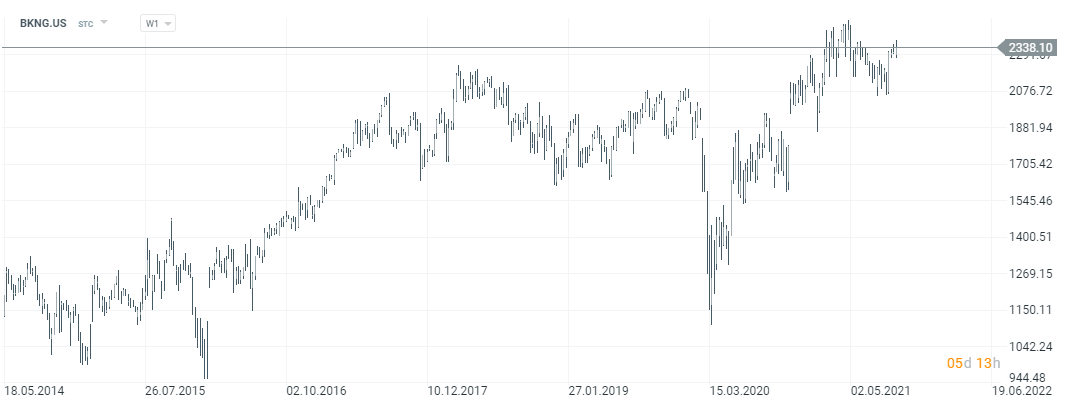
Booking.com stock chart, interval W1. Source: xNUMX XTB.
Verisign
This is a company that provides domain name registration services. It offers the possibility of registering the names of websites under the most popular addresses .com and .net. At the end of Q2021 157, the company had 13,6 million registered websites with the .com ending and 5 million with the .net ending. The company manages to increase its customer base by an average of 76% per year. It is worth bearing in mind that the company's significant “renewal rate” ratio is approximately 24%. The company is a cash-generating machine by offering essential services for internet business, which at the same time does not cost too much. The company does not have large capital expenditure, which allows it to generate high free cash flow (FCF). The company's current capitalization exceeds $ XNUMX billion.
| $ million | 2017 | 2018 | 2019 | 2020 |
| revenues | 1 165 | 1 215 | 1 232 | 1 265 |
| operational profit | 707,7 | 767,4 | 806,1 | 824,2 |
| operating margin | 60,75% | 63,16% | 65,43% | 65,15% |
| net profit | 457,2 | 582,5 | 612,3 | 814,9 |
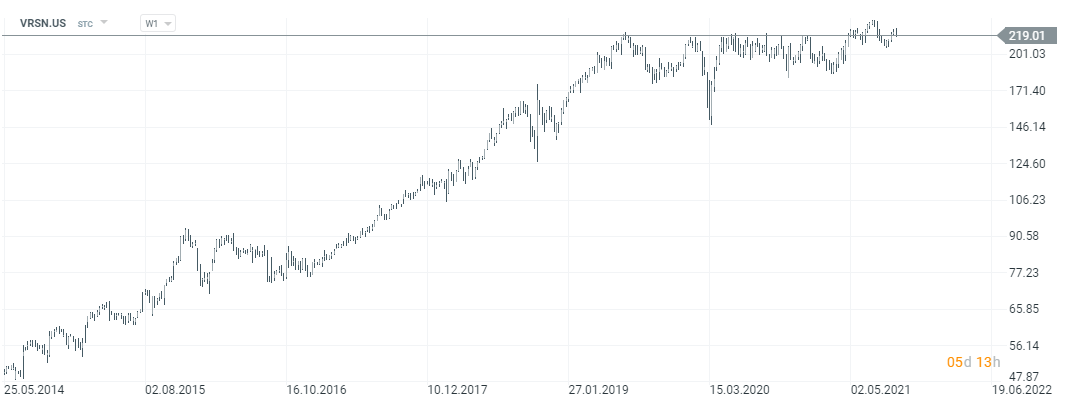
Verising stock chart, interval W1. Source: xNUMX XTB.
Adobe
It is a company whose history dates back to 1982. In the largest segment - Digital Media - the company offers the possibility of creating, publishing, promoting and monetizing digital content. The flagship product of the company is Creative Cloud (operating in the form of a subscription). The recipients of products in this segment are content creators, designers, employees of marketing departments and application developers. It is also worth mentioning an important product which is Adobe Document Cloud. Thanks to its product offer, Adobe facilitates the digitization of document workflow within companies. The next largest segment is the segment Digital experiencewhere Adobe, via the Adobe Expericene Cloud product, offers the possibility of integrating online marketing with e.g. website analytics. This makes it possible to easily personalize in real time, which helps in better monetization of the product. The company's current capitalization exceeds $ 300 billion.
| $ million | 2017 | 2018 | 2019 | 2020 |
| revenues | 7 302 | 9 030 | 11 171 | 12 868 |
| operational profit | 2 168 | 2 840 | 3 268 | 4 237 |
| operating margin | 29,69% | 31,45% | 29,25% | 32,93% |
| net profit | 1 694 | 2 591 | 2 951 | 5 260 |
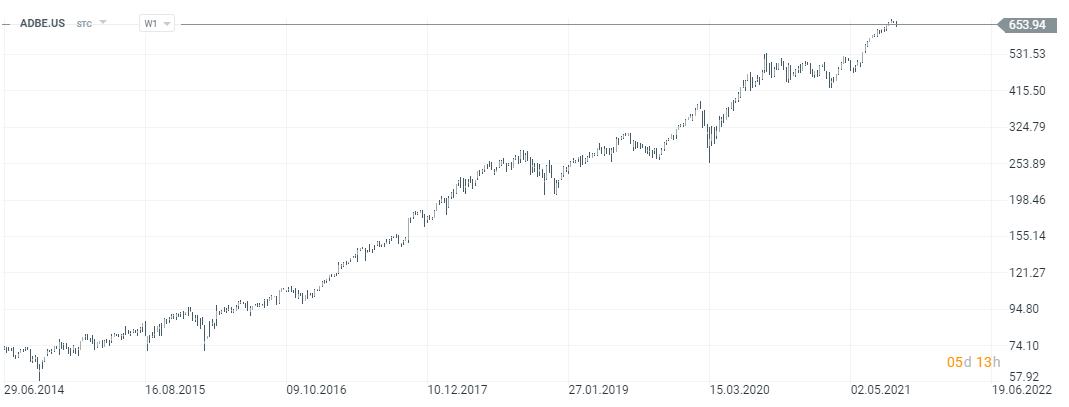
Adobe stock chart, interval W1. Source: xNUMX XTB.
Netflix
It is a company that has changed the way consumers spend their free time watching TV. The origins of Netflix date back to 1997, when the company dealt with the offer of DVD rental in the subscription model. A milestone in the company's development was the start of offering streaming of Video content. As a result, users had access to a wide library of movies and series for a small price. Netflix used an undeveloped niche, which neither TV stations nor owners of rights to films and series did not want to bend down for. Thanks to this, Netflix was able to quickly build a scale and start creating its own movies and series to also have its own content, which would allow it to distinguish itself from the competition. Many of Netflix's productions have become cult (including House of Cards). Currently, the company has over 200 million subscribers in 190 countries around the world. The company's capitalization exceeds $ 255 billion.
| $ million | 2017 | 2018 | 2019 | 2020 |
| revenues | 11 693 | 15 794 | 20 156 | 24 996 |
| operational profit | 838,7 | 1 605 | 2 604 | 4 585 |
| operating margin | 7,17% | 10,16% | 12,92% | 18,34% |
| net profit | 558,9 | 1 211 | 1 867 | 2 761 |
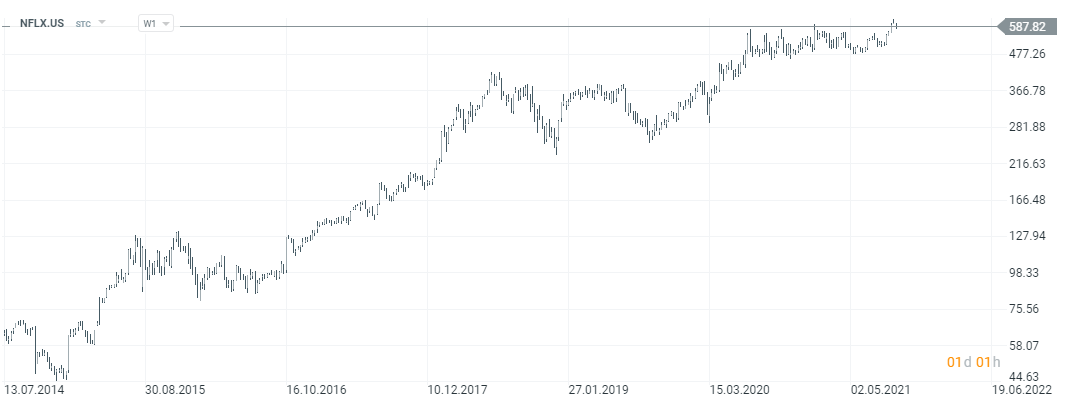
Netflix stock chart, interval W1. Source: xNUMX XTB.
Starbucks
It is one of the most famous consumer brands in the world. The company was founded in 1971 in Seattle, Washington. From the very beginning, the company focused on the quality of its products and services (famous barista training) and the creation of places to spend time pleasantly. At the same time, the company was constantly increasing its scale gaining an advantage over dispersed competition. In addition to coffee and other drinks, Starbucks coffee shops offer food. The company develops both through a network of its own stores and a franchise. The company operates under the following brands: Starbucks, Teavana, Seattle's Best Coffee, Evolution Fresh, Ethos, Starbucks Reserve and Princi. Starbucks boasts that it has over 32 stores around the world. The current capitalization of the company is $ 000 billion.
| $ million | 2017 | 2018 | 2019 | 2020 |
| revenues | 22 387 | 24 720 | 26 509 | 23 518 |
| operational profit | 3 897 | 3 807 | 3 916 | 1 518 |
| operating margin | 17,41% | 15,40% | 14,77% | 6,45% |
| net profit | 2 885 | 4 518 | 3 599 | 928 |
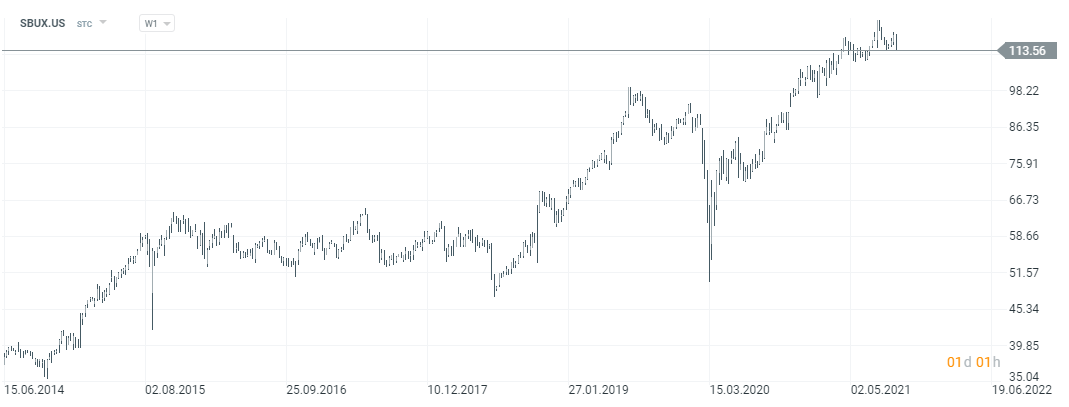
Starbucks stock chart, interval W1. Source: xNUMX XTB.
Mondelez
It is an American company that is one of the largest producers of sweets and snacks in the world. Mondelez is one of the Fortune 500 companies. The current structure of the company was established in 2012 (with the exclusion from Kraft Foods), but the origins of the company date back to the 50s. The company has a very strong portfolio of brands, which include, among others Cadbury, Milka, Toblerone, Oreo, BelVita, LU or Alpen Gold. The company also owns 48% of JDE (Jacobs Douwe Egberts). JDE owns brands such as Jacobs, Tassiomo, Gevalia. In the Mondelez group, the largest sales are generated by the biscuits and cakes segment (31% of revenues). Chocolates are next with a 4% share in sales. The beverages segment generates the lowest sales (79%). The company employs 000 people. The company's current capitalization is $ 85 billion.
| $ million | 2017 | 2018 | 2019 | 2020 |
| revenues | 25 896 | 25 938 | 25 868 | 26 581 |
| operational profit | 3 750 | 3 767 | 4 087 | 4 297 |
| operating margin | 14,48% | 14,52% | 15,80% | 16,17% |
| net profit | 2 828 | 3 317 | 3 929 | 3 555 |
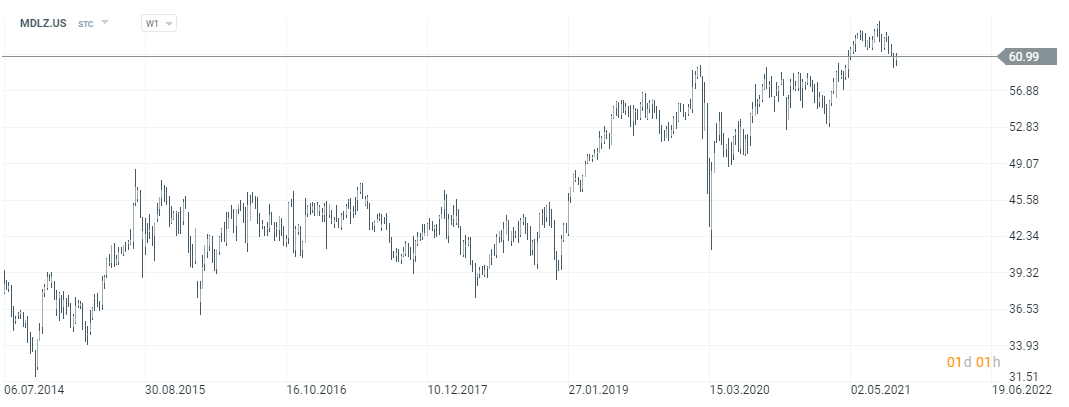
Mondelez stock chart, interval W1. Source: xNUMX XTB.
What may affect the value of the Nasdaq Composite Index?
The condition of the American, world economy and individual industries
Each company that is a component of the index does not operate in a vacuum. As a result, its activity depends on the condition of the economy in which it operates. For example, the condition of companies such as JD.com or Pinduoduo depends on the situation on the Chinese retail market. On the other hand, companies focused mainly on the US market will be more sensitive to changes in the US economic situation.
It is also worth mentioning the global trends that may support some companies. An example is the growing importance of online payments that help, for example, companies such as PayPal. On the other hand, the increase in online sales gives companies such as Amazon a breeze.
Financial results of companies
In the long term, the financial results generated by the enterprise are the most important in the valuation of the company. Increasing revenues, profits, and free cash flow (FCF) are solid arguments for long-term increases in stock prices. For this reason, it is worth following the financial results of companies included in the index. Especially those that have the greatest impact on changing the index value.
Futures contracts
The Nasdaq Composite futures are not the most popular index providing exposure to technology companies. He has the priority palm Nasdaq 100 index. In the case of Nasdaq Composite futures, investors can trade futures e-mini.
1 point of this contract is valued at $ 20.
As a result, the notional value of the futures contract is over $ 300. It is possible to trade with the next two quarterly futures. For example, as of September 000, 19, an investor can trade contracts that expire in December 2021 and March 2021.
Contracts for exchange differences (CFDs)
Another option, especially popular with retail traders, is to speculate on Contracts for Difference (CFDs). Unfortunately, the Nasdaq Composite index itself is very unpopular with Forex brokers, unlike the NASDAQ100. However, it should be remembered that due to the lack of standardization of CFD instruments, the offer may differ depending on the broker. Below we present selected offers of brokers on CFDs based on NASDAQ100.
| Broker |  |
 |
|
| End | Poland | Cyprus, Australia, St. Vincent & Grenadines | Great Britain, Cyprus |
| NASDAQ100 symbol | US100 | US100 | USTEC |
| Min. Deposit | PLN 0 (recommended min. PLN 2000 or USD 500, EUR) |
50 USD | PLN 100 |
| Min. Lot value | price * 5 USD | price * 1 USD | price * 1 USD |
| Commission | - | - | - |
| Platform | xStation | MT4, MT5, cTrader | MT4, MT5 |
CFDs are complex instruments and come with a high risk of losing money rapidly due to leverage. From 72% to 89% of retail investor accounts record monetary losses as a result of trading CFDs. Think about whether you understand how CFDs work and whether you can afford the high risk of losing your money.
Chart - NASDAQ 100
ETF on Nasdaq Composite
It is possible to invest in ETFs exposure to the Nasdaq Composite Index (Fidelity Nasdaq Composite Index ETF). However, due to its liquidity and low management costs, you can choose an ETF that mimics the Nasdaq 100 Index, which is the 100 largest and most liquid components of the Nasdaq Composite Index.
An example is the largest ETF of its kind. It is Invesco QQQ Trust. The product was created in 1999, so close to the top of the internet bubble. Currently, over $ 192 billion in assets under management (AUM) has been accumulated in QQQ. The annual fund management cost (TER) is 0,20%.
It is also worth mentioning the Polish ETF exposing the Nasdaq 100 index. It is Nasdaq-100 PLN-Hedged Beta ETF.
Instead of ETFs, you can also choose to buy traditional stocks and "compose" your own portfolio based on US technology companies.
Brokers offering stocks and ETFs
For example on XTB Today, we can find over 3500 equity instruments and 400 ETFs, a Saxo Bank over 19 companies and 000 ETF funds.
| Broker | |
||
| End | Poland | Denmark | Cyprus * |
| Number of exchanges on offer | 16 exchanges | 37 exchanges | 24 exchanges |
| Number of shares in the offer | approx. 3500 - shares circa 2000 - CFDs on shares |
19 - shares 8 - CFDs on shares |
approx. 3 - CFD on shares |
| The amount of ETF on offer | approx. 400 - ETF approx. 170 - CFD on ETF |
3000 - ETF 675 - CFD on ETF |
approx. 100 - CFD on ETF |
| Commission | 0% commission up to EUR 100 turnover / month | according to the price list | Spread depends on the instrument |
| Min. Deposit | PLN 0 (recommended min. PLN 2000 or USD 500, EUR) |
0 PLN / 0 EUR / 0 USD | PLN 500 |
| Platform | xStation | SaxoTrader Pro Saxo Trader Go |
Plus500 platform |
* PLUS500 CY offer
CFDs are complex instruments and come with a high risk of losing money rapidly due to leverage. From 72% to 89% of retail investor accounts record monetary losses as a result of trading CFDs. Think about whether you understand how CFDs work and whether you can afford the high risk of losing your money.


Leave a Response