


iShares S&P 100 ETF - exposure to the largest US companies [Guide]

For many investors, exposure to large US companies means buying a futures or ETF with exposure to S&P 500 index. However, some investors may prefer to invest in only the largest components of the S&P 500 index. It fulfills this task quite well S&P 100 indexwhich groups only the largest components of the US 'flagship' index. It is an index that gives exposure to America's largest blue chip companies. These are not bare words. At the end of 2020 the S&P 100 index accounted for approximately 67% of the capitalization of the S&P 500 index and 54% of the entire US stock market. In this article, we will provide you with information about ETF giving you exposure to the largest US stocks - iShares S&P 100 (OEF).
Information about the S&P 100
The history of the S&P 100 dates back to the late 11s. The first quotation date for this index was September 1989, 500. Like most indices, it is weighted by capitalization. Of course, the weights are adjusted for the share of free-float shares (the so-called float-adjusted market capitalization). The index composition is selected by the index committee. Although the index is not as popular as the S&P 500, it is a significant benchmark for many asset managers in many countries. To be included in the index, stocks must be included in the S&P XNUMX index. The S&P Dow Jones Indices also listed the minimum requirements that the index component must meet. These include:
- S&P 500 component with options trading possible.
- The minimum capitalization of the company is $ 13,1 billion.
- Companies listed via ADS, ADRs and closed-end funds are excluded.
It is not hard to guess that the leading components of the S&P 100 index are leading technology companies. Among the 10 largest components of the index, only two are from the "old economy": Berkshire Hathaway i UnitedhealthGroup. It is worth noting that at the end of December 2021, there is no representative of the banking or raw materials sector among the ten largest components of the index. They have the largest share in the index technology companies (33,7%), they are in second place companies from the discretionary goods sector (14,3%) and communication services (14,1%). In discretionary goods they are also included e-commerce platforms. Even though the index still includes large companies, it is also concentrated. The top 10 components account for approximately 44% of the S&P 100 capitalization.
In the S&P 100 index at the end of December 2021 it was 101 components (two stocks of Alphabet), with an average cap of more than $ 282,114 billion. The median capitalization of the index companies exceeded $ 175,668 billion. So it is an index made up of real giants.
- IThe investor can invest in the index as follows:
- Buy call options or put put options on the S&P 100 index
- Purchase an interest in the components of the index
Investing with index derivatives is not cheap. The multiplier for the option is $ 100. This means that the notional contract value now exceeds $ 200. On the other hand, investing in individual components and mapping index weights is labor-intensive and requires significant capital. In order to engage smaller capital, you can use investing in some shares. Some brokers have this feature on their platforms.
iShares S&P 100 ETF (OEF)
A convenient solution to get exposure to the S&P 100 index is to use the ETF offer. One of them is iShares S&P 100 ETFwhich is listed in the US market. The mentioned ETF was established in October 2000. At the end of January 19, 2022, the assets under management totaled $ 9,16 billion. As in the case of the index, the ETF consists of 101 companies. Average price/Profit (P / E) on January 19, 2022 was 31,3. It is also worth adding that the moving dividend yield was 1,05%. The annual management cost is 0,2%, which is quite a normal level of fees for an ETF. Due to the fact that the ETF replicates the index physically, the distribution of sectors and the largest positions in the portfolio is very similar to the composition of the S&P 100. For this reason, below we present a list of the top 10 positions in the portfolio and briefly introduce selected 8 companies.
Biggest ETF positions as of January 19:
| Company name | Participation in the index |
| Apple Inc | 10,06% |
| Microsoft Corp. | 8,85% |
| Amazon.com Inc. | 5,30% |
| Alphabet Inc. Class A | 3,16% |
| Tesla Inc. | 3,15% |
| Alphabet Inc. Class C | 2,95% |
| Meta Platforms Inc. Class A | 2,94% |
| Nvidia Corp. | 2,43% |
| Berkshire Hathaway Inc. class B | 2,24% |
| JP Morgan Chase & Co | 1,71% |
| Johnson & Johnson | 1,70% |
A
It is one of the most famous technology companies in the world. She is best known for her search engine Google, Youtube platform, Android system or Google Play store. Although advertising revenue is the main source of revenue, the business diversifies with each passing year. Alphabet has a cloud segment (Google Cloud) in which it competes with Microsoft or AWS (Amazon). It also has an offer of free Office solutions (Google Excel etc.). Of course, Waymo (autonomous cars) can be mentioned among other projects. The current capitalization of the company exceeds $ 1 billion.
| Alphabet ($ million) | 2017 | 2018 | 2019 | 2020 |
| revenues | 110 855 | 136 819 | 161 857 | 182 527 |
| operational profit | 28 914 | 32 595 | 36 482 | 41 244 |
| operating margin | 26,08% | 23,82% | 22,54% | 22,60% |
| net profit | 12 662 | 30 736 | 34 343 | 40 269 |
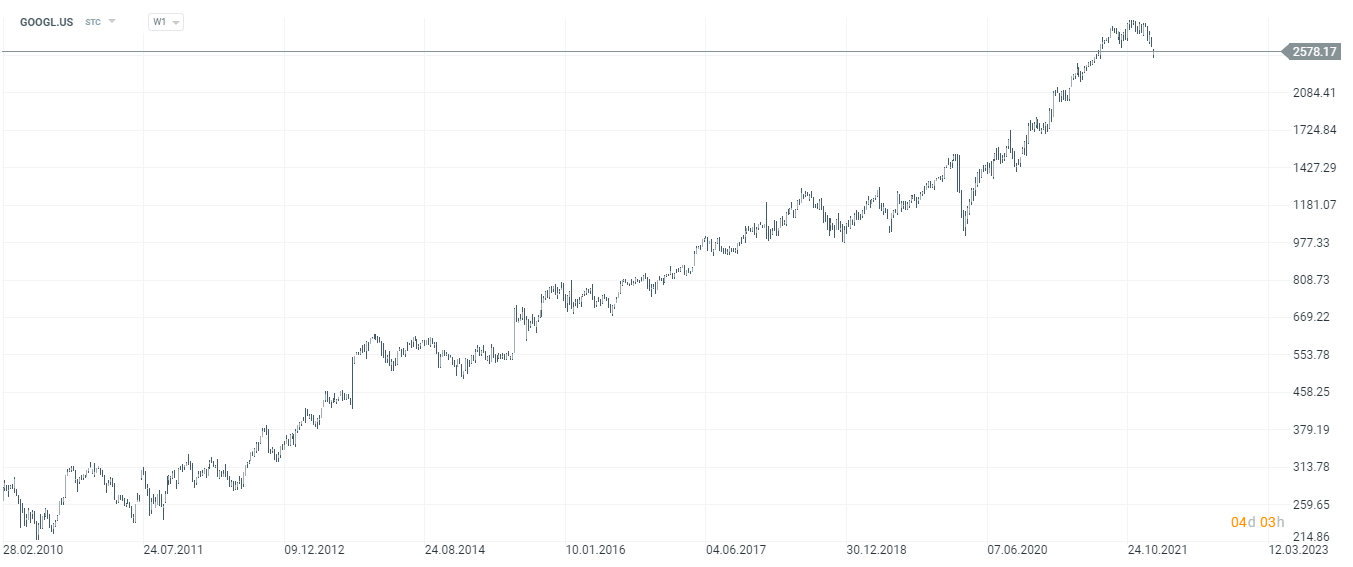
Google stock chart, interval W1. Source: xNUMX XTB.
Amazon
Amazon mainly associated with the marketplace, which has a dominant position in the United States and very strong in many countries in Europe (including Germany) and Asia (including South Korea, Japan). However, in addition to its core business, the company is also a leader in providing cloud services in the United States, Canada and the European Union. Its Amazon Web Services (AWS) has been a benchmark in this market for many years. Amazon is also present on the gaming market (Twitch platform) and offers video on demand services (Amazon Prime Video). The Amazon Prime subscription offer is very popular, as it gives subscribers a wide range of benefits. Amazon also allocates a lot of money to the development of AI technology (including medicine). The current capitalization of the company is $ 1 billion.
| Amazon (million $) | 2017 | 2018 | 2019 | 2020 |
| revenues | 177 866 | 232 887 | 280 522 | 386 064 |
| operational profit | 4 106 | 12 421 | 14 404 | 22 899 |
| operating margin | 2,31% | 5,33% | 5,13% | 5,93% |
| net profit | 3 033 | 10 073 | 11 588 | 21 331 |
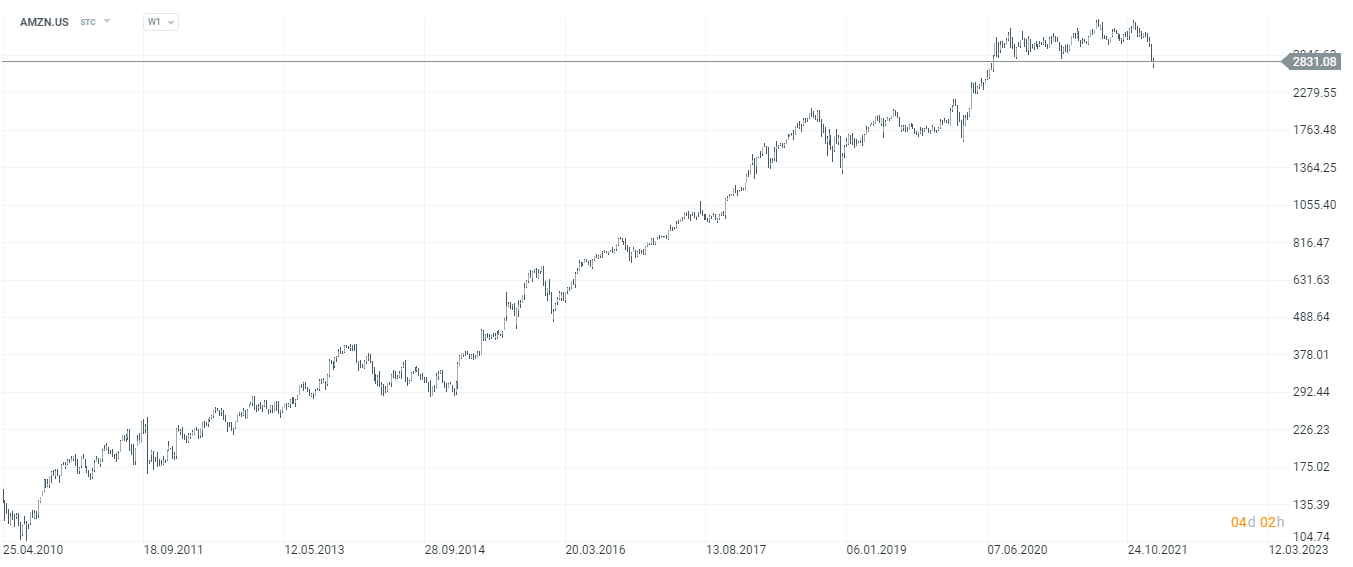
Amazon stock chart, interval W1. Source: xNUMX XTB.
Microsoft
Microsoft is one of the icons of the American technology market. It is a long-lived company that has survived, among others burst dotcom bubble. For many years, Microsoft has been considered a company that cuts off coupons from its almost monopolistic position on the market of the computer operating system and office software. Investments were often unsuccessful, which was reflected in the unsuccessful entry into the market of mobile phones and the operating system for smartphones. However, it is now a completely different company. It has a cloud service and is one of the "Big Three" of this market in the United States. The company boasts that 95% of Fortune 500 companies use the Azure solution. Importantly, Microsoft is also present on the gaming market. It is one of the largest console suppliers on the global market. Being aware that the hardware itself is not everything, Microsoft introduced the Game Pass service, i.e. a subscription that allows access to over 100 games. The next step in the development of the gaming offer was the recent announcement of plans to acquire Activision Blizzard for less than $ 69 billion.
| Microsoft (million $) | 2018FY | 2019FY | 2020FY | 2021FY |
| net income | 110 360 | 125 843 | 143 015 | 168 088 |
| operational profit | 35 058 | 42 959 | 52 959 | 69 916 |
| operating margin | 31,77% | 34,14% | 37,03% | 41,59% |
| net profit | 16 571 | 39 240 | 44 281 | 61 271 |
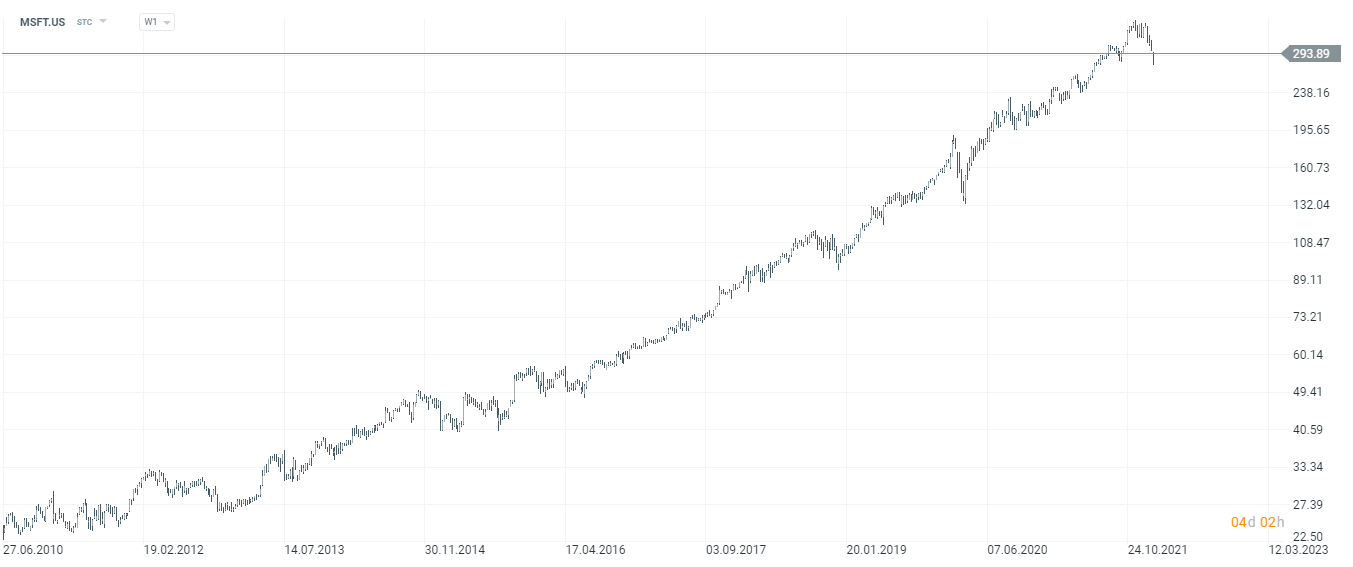
Microsoft stock chart, interval W1. Source: xNUMX XTB.
MetaPlatforms
Until October 2021, the company was called Facebook - just like the main service of the company. However, as a result of a change in strategy and the start of entering new markets, the company decided to change the name. In addition to the social platform - Facebook, the company also has the Messenger and WhatsApp applications. The company paid $ 2014 billion for WhatsApp in 19. Moreover, the company has been the owner of Instagram since 2012, for which Facebook paid $ 1 billion. The amount that shocked 10 years ago now seems very low. This is one of the best invested money by the company so far. However, these are not all of the company's products. Facebook strongly believes in the development of the Metaverse. For this reason, for several quarters, he has been spending billions of dollars to develop AR / VR equipment from the Oculus brand. The Oculus project itself was acquired by Facebook in 2014 for $ 2 billion.
| Meta ($ million) | 2017 | 2018 | 2019 | 2020 |
| revenues | 40 653 | 55 838 | 70 697 | 85 965 |
| operational profit | 20 203 | 24 913 | 28 986 | 32 671 |
| operating margin | 49,70% | 44,62% | 41,00% | 38,00% |
| net profit | 15 920 | 22 111 | 18 485 | 29 146 |
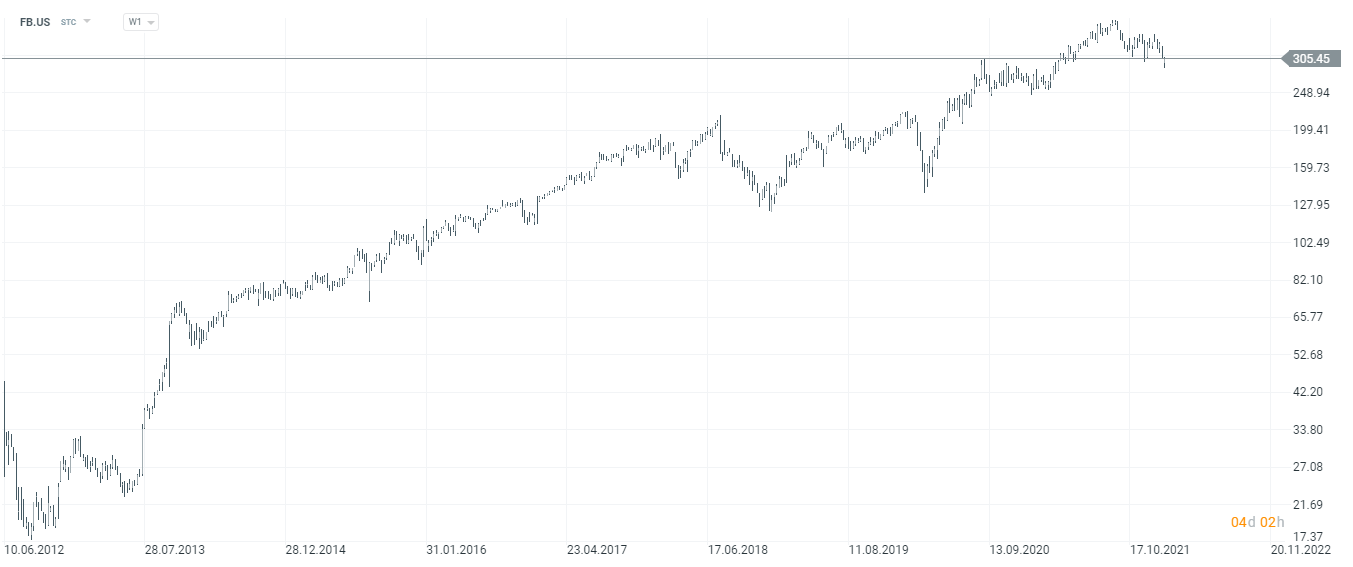
Meta Platforms stock chart, interval W1. Source: xNUMX XTB.
Tesla
It is one of the most popular stocks of the American stock exchange. company Tesla was founded in 2003 in Austin (Texas). The founder and longtime CEO of j is Elon Musk, who is as well known for his business successes as his eccentric statements. Tesla is a producer of electric cars that have wide autonomy. Additionally, Tesla is developing its fast vehicle charging network (Tesla Superchargers). What's more, Tesla tries to organize financing and leasing of its cars. However, apart from that, it also has an Energy Generation and Storage segment. In this segment, Tesla develops and sells products for the production of electricity from the sun and energy storage devices. The company employs over 70 people. It is one of the few companies that in its history has been valued at over $ 000 billion.
| Tesla ($ million) | 2017 | 2018 | 2019 | 2020 |
| revenues | 11 759 | 21 461 | 24 578 | 31 536 |
| operational profit | - 1 632 | -253 | 80 | 1 951 |
| operating margin | -13,88% | -1,18% | 0,32% | 6,19% |
| net profit | -1 962 | -976 | -862 | 721 |
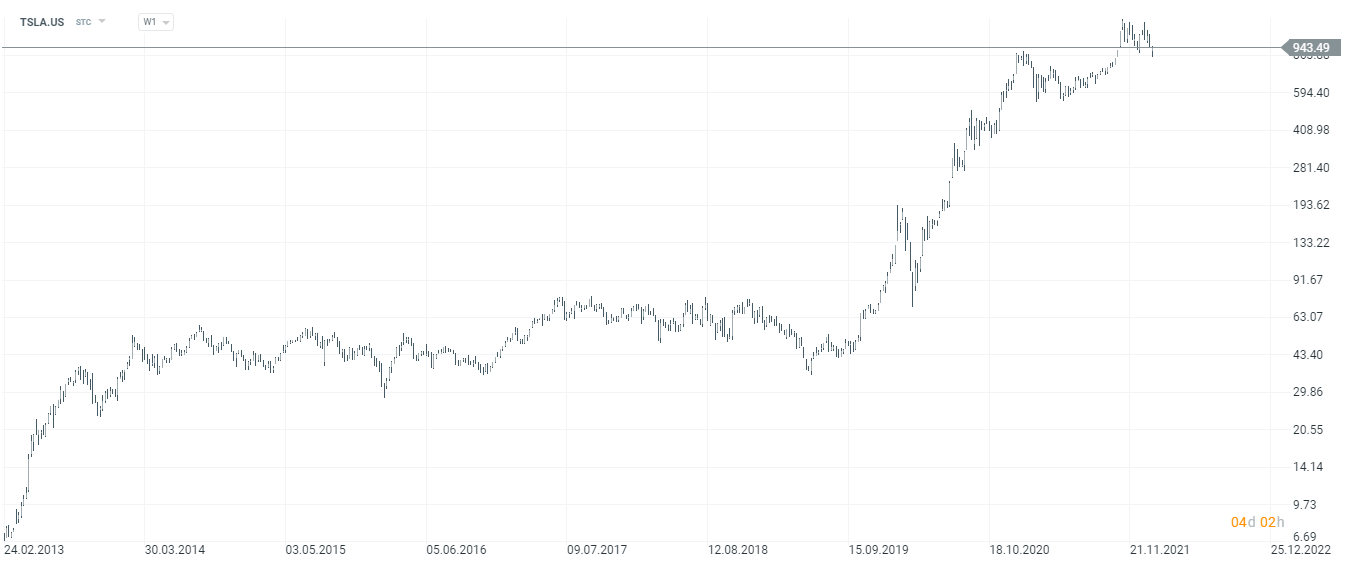
Tesla stock chart, interval W1. Source: xNUMX XTB.
Nvidia
The company was founded in 1993. NVidia operates in two segments: Graphics and Compute & Networking. The first segment, as the name suggests, is the production of graphics cards (GeForce). Another offer is GeForce Now, a game streaming service. In addition, this segment also includes graphics cards from the Quadro / NVidia RTX family. This type of cards has increased efficiency when working with applications from the CAD (computer aided design) family. The second segment includes products that are used in industries such as data centers, robotics, and automotive. As an example, we can mention dedicated graphics processors for data centers, which allow to speed up procedures related to AI, Deep Learning or HPC (High-performance computing). NVidia employs approximately 19 people.
| Nvidia ($ million) | 2018FY | 2019FY | 2020FY | 2021FY |
| revenues | 9 715 | 11 716 | 10 918 | 16 675 |
| operational profit | 3 210 | 3 804 | 2 846 | 4 721 |
| operating margin | 33,04% | 32,47% | 26,07% | 28,31% |
| net profit | 3 047 | 4 141 | 2 796 | 4 332 |
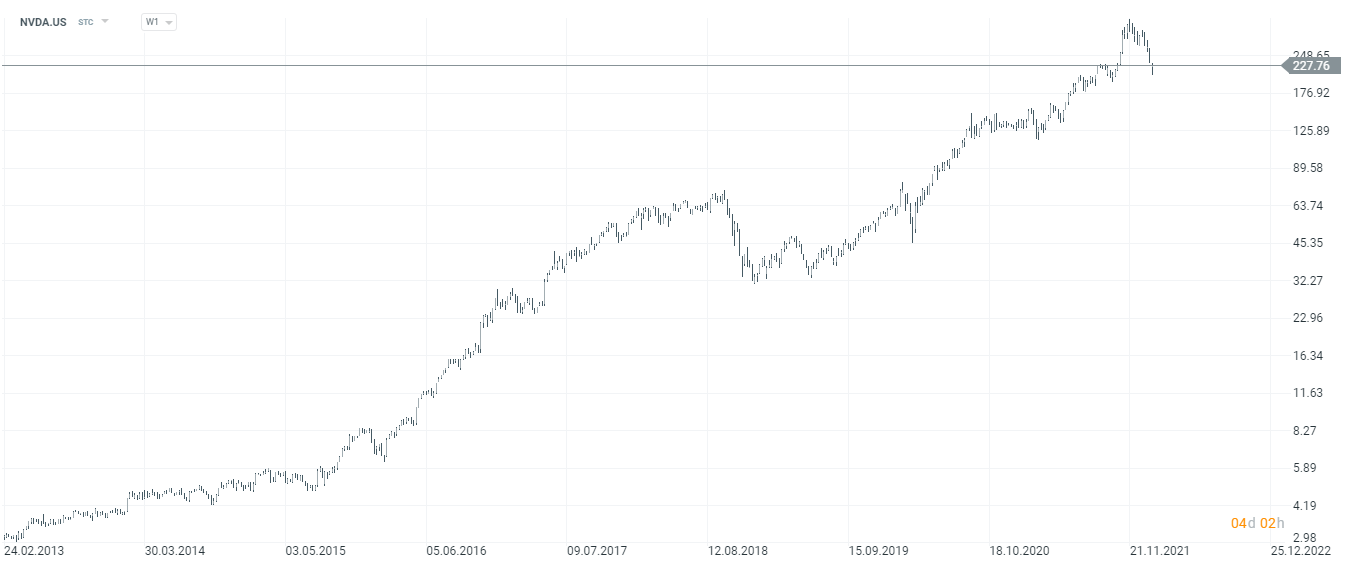
Nvidia stock chart, interval W1. Source: xNUMX XTB.
Apple Lossless Audio CODEC (ALAC),
It is one of the few companies with a capitalization of more than $ 2 billion. Apple Lossless Audio CODEC (ALAC), was founded in 1977 and has already had several twists in its history. One of them was the decline in sales in the 90s and the problems with inventing new products. The second turn was the death of the face of Apple - Steve Jobs. Each time the company emerged from the crisis unscathed. Apple is best known for selling iPhones, which are the main source of revenue for the time being. In addition, Apple also sells other products, incl. such as Mac, AirPod Max, Apple Watch. In addition to selling devices, Apple is constantly expanding its service offer. The App Store allows users to download applications to their devices. Another product is Apple Music, which allows users to listen to music on demand. In addition, Apple has its own payment application (Apple Pay) and the Apple TV + streaming offer.
| Apple (million $) | 2018FY | 2019FY | 2020FY | 2021FY |
| revenues | 265,595 | 260 174 | 274 515 | 365 817 |
| operational profit | 70 898 | 63 930 | 66 288 | 108 949 |
| operating margin | 26,69% | 24,57% | 24,15% | 29,78% |
| net profit | 59 531 | 55 256 | 57 411 | 94 680 |
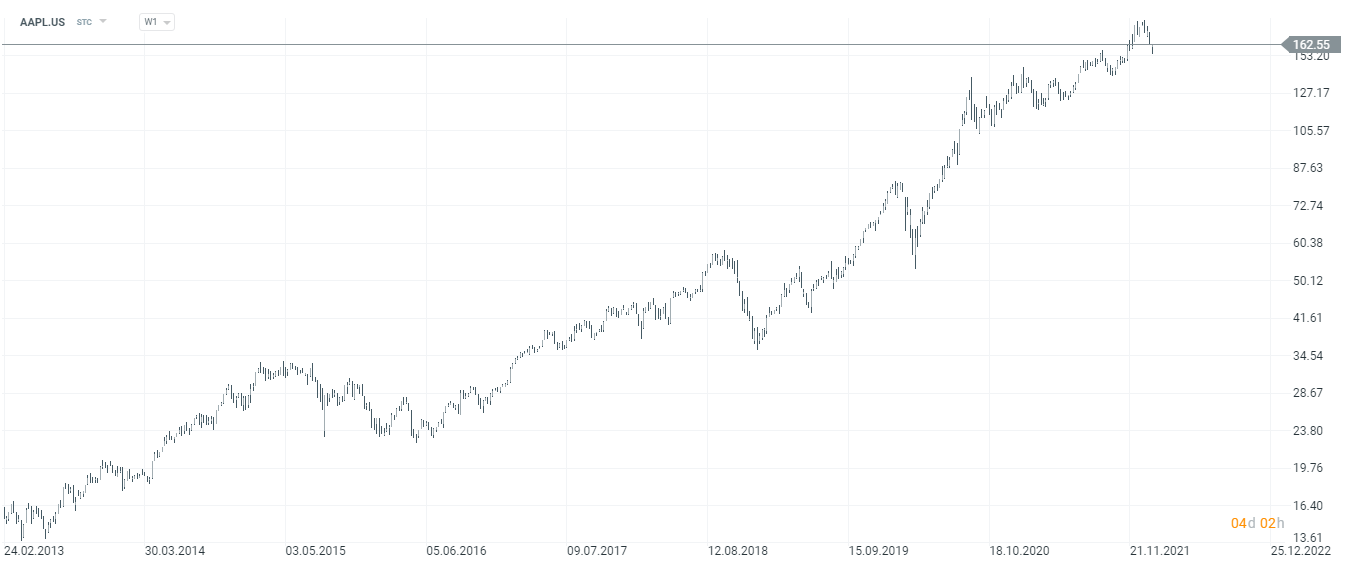
Apple stock chart, interval W1. Source: xNUMX XTB.
McDonald's
It is one of the most recognizable fast-food chains in the world. At the end of 2020, the company had 39 restaurants, 198 of which were franchised. McDonald's is known for its flagship products, which are: Big Macs, hamburgers, cheaseburgers and McNuggets. The company's revenues include both sales in its own restaurants and loyalty fees charged to franchisees. The franchise model allows the company to develop faster and is not capital-intensive. As a result, the opening of a new franchise restaurant does not result in a significant increase in capital expenditure. Franchise agreements provide a relatively stable source of income. A franchise agreement is usually signed for 36 years. McDonald's supplies food, packaging and equipment from a number of independent suppliers. The company itself employs over 521 people, while franchise outlets employ over two million people.
| McDonald's ($ million) | 2017 | 2018 | 2019 | 2020 |
| revenues | 22 820 | 21 258 | 21 364 | 19 208 |
| operational profit | 8 392 | 8 626 | 8 955 | 7 124 |
| operating margin | 36,77% | 40,58% | 41,92% | 37,09% |
| net profit | 5 192 | 5 924 | 6 025 | 4 731 |
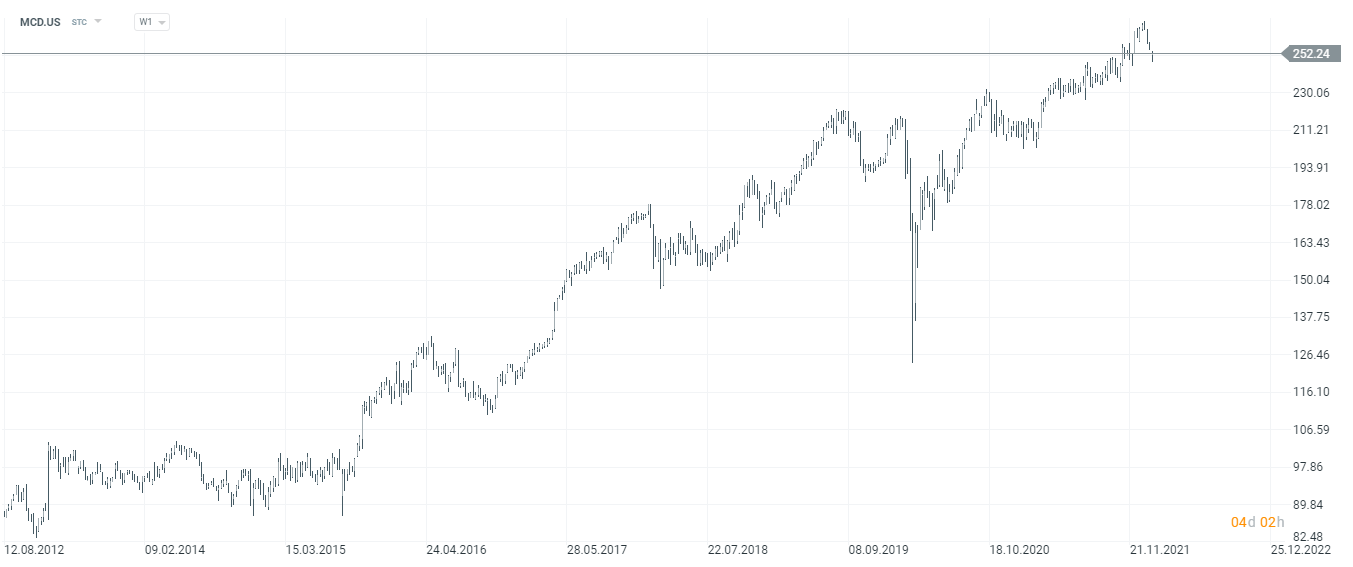
McDonald's stock chart, interval W1. Source: xNUMX XTB.
Additional information about the OEF
iShares S&P 100 ETF (OEF) has generated average annual rate of return (total return) of approximately 7,3%. It may not be amazing, but keep in mind that the calculation started in March 2000, so around the top of the dotcom bubble. Over the next two years, the value of the index dropped as much as 40% (followed by the ETF results). However, over the past 10 years, the average annual rate of return on ETFs has been as high as 16,6%. The last three years have accounted for a staggering 27,3% of the annual average. Of course, past performance is not a guarantee of obtaining similar results in the future. The investor must be aware that, in fact, the condition of the largest components of the S&P 500 index is assumed.
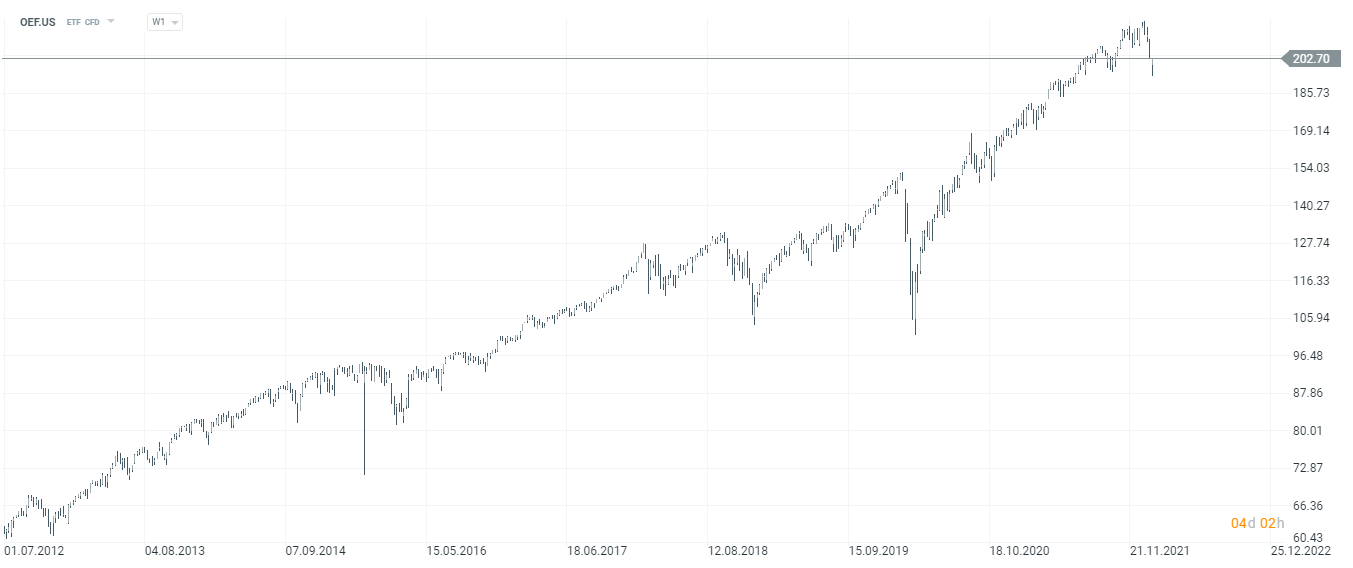
IShares S&P 100 ETF Chart, Interval W1. Source: xNUMX XTB.
Forex brokers offering ETFs
| Broker |  |
 |
|
| End | Poland | Denmark | Great Britain / Cyprus |
| The amount of ETF on offer | approx. 400 - ETF approx. 170 - CFDs on ETFs |
3000 - ETF 675 - ETF CFDs |
397 - ETF CFDs |
| Min. Deposit | PLN 0 (recommended min. PLN 2000 or USD 500, EUR) |
PLN 0 / EUR 0 / USD 0 | PLN 5 |
| Platform | xStation | SaxoTrader Pro Saxo Trader Go |
MetaTrader 5 |
CFDs are complex instruments and come with a high risk of losing money rapidly due to leverage. From 72% to 89% of retail investor accounts record monetary losses as a result of trading CFDs. Think about whether you understand how CFDs work and whether you can afford the high risk of losing your money.


