


Inside Bar - trading with a high chance of winning with low risk?

Inside Bar is one of the most popular methods used in price action. This strategy belongs to more "Traditional" trading forms. Where does the interest of (not only beginners) traders in this model for trading come from? Is it really one of the strategies that, with a low risk exposure, carries a high chance of a profitable position?
Inside Bar - where to look for it?
At the beginning, let's start with the book's concept of what an inside bar actually is. We call it an internal candle because it is between the minimum and maximum of the bar preceding it. In a more extended perspective, we can distinguish the so-called "Mother bar". Using the chart below as an example, the mother bar is the bar that precedes the inside bar that is marked. According to alternative terminology, the first bar, or what we call the maternal bar, is usually a significant demand or supply movement in the market. Immediately behind it, we can observe internal bars, or inside bars, which are "contained" in the preceding candle. For ease of use, the mother bar price range is marked with red lines.
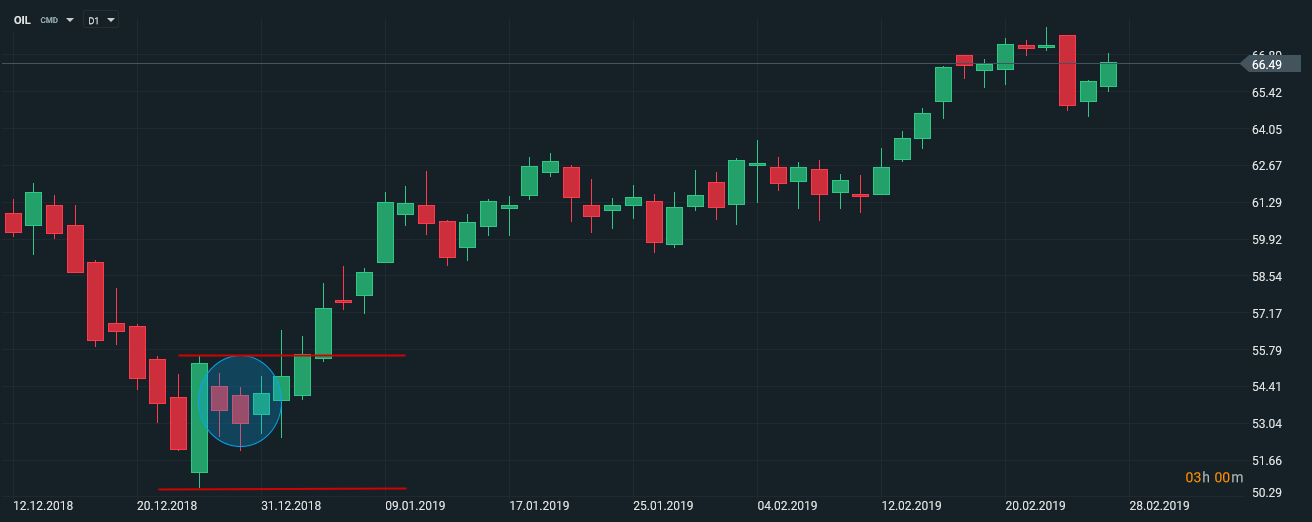
Source: platform xStation, XTB.
Where to look for opportunities to enter the market?
In general, there are several options, and thus strategies that use the inside bar. The general idea is to "hunt" to break the market. Based on probability, the color of the mother's candle usually determines the better chance of generating a demand or supply movement. If, as in the example above, it is green, there is a greater chance that the market will be climbing. Until then, we can talk about the universal use of the inside bar. The problem and at the same time strategic differentiation arises when determining the moment of entry, setting take profit and level stop loss. I will present one of the safest, in my opinion, the possibility of entering the position. It is based on the buy / sell level of the internal candle high and low, or its opening and closing price (if there are no wicks). For more inside bars, it uses the full range of high and low prices, not just the first inside bar.

Source: platform xStation, XTB.
Blue dashed lines form a certain price channel. They are the moment of entering the position and at the same time constitute the stop loss level for the reverse transaction. What exactly do I mean? By entering a buy transaction (a green arrow indicating a dotted line), the price at which you bought the instrument is also a stop loss order for short play. However, the level (red arrow), at which we will assume sales (in this case) of crude oil, will set us the level of maximum loss for longi. The continuous, blue lines are in an auxiliary. They constitute resistance in both cases. Their puncture by the pulse is additional confirmation of the generated traffic. What's more, going down to the lower interval, eg H4 / H1, we can see that we are able to select the right moment to conclude a transaction with greater precision. It is only on them that it is clearly visible that the levels (dashed lines) created by the inside bars are nothing else than the price channel of the correction, which followed a significant growth impulse.
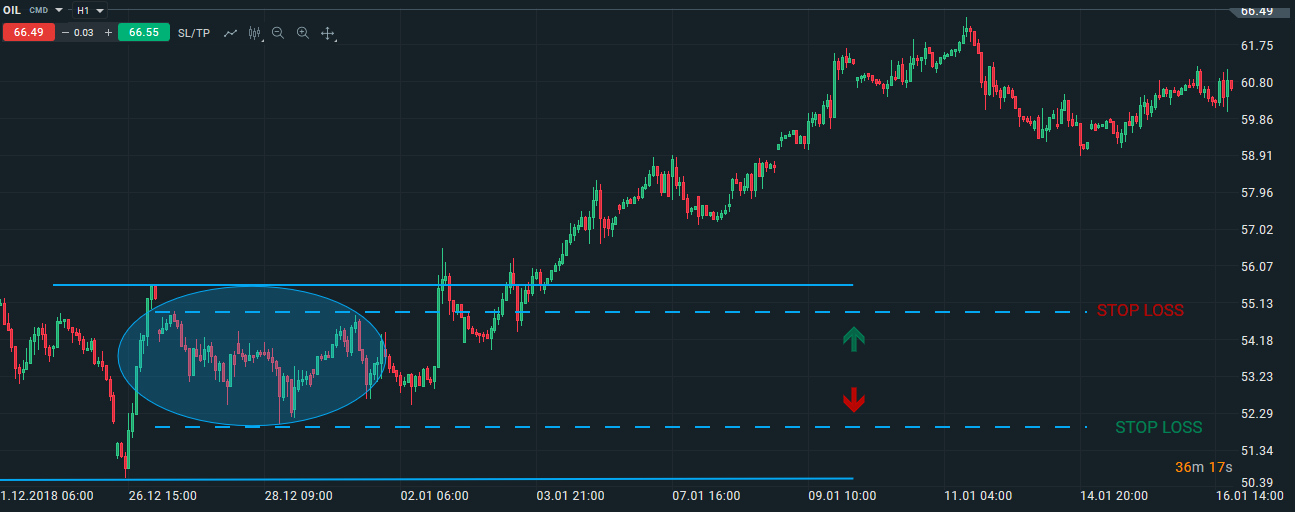
Source: platform xStation, XTB.
Time interval a Inside Bar
What time horizon should I take and whether the size of the inside bar candle is important?
This strategy works best at higher intervals, where signals in the form of the inside bar occur less frequently than eg on H1 or M30. Therefore, it is best to observe the daily opening and closing prices of candles.
An inner candle, which is almost equal to the mother pillar, generates a lower signal value, as does the inside bar, which precedes the crowded price range.
Summation
One should not assume in advance that the inside bars are the perfect and the best determinant of the impulse on the market. Their undoubted advantage is simplicity in application. Internal candles are not always the most cost-effective way to identify good trade entries. This strategy will be better for people who intend to maintain their position for a long time (about a few or a dozen or so days).
Of course, you can set a rigid TP, although the greatest profit brings the transaction to a possible downward signal. The SL levels and position positions presented by me can be freely modified. Their "narrowing down" may only seem to be a limitation of the potential loss. Any breakouts (which can be observed by the size of the wicks) may only be speculative. But still catch the set (for fewer pips) stop losses, and then the market returns to the direction assumed by us. It is worth taking this into account and still consider high / low (if any) as benchmarks than open / close candle.


