


FTSE MIB Index - how to invest in Italian blue chip companies [Guide]

Italy is one of the most important economies of the Old Continent and the European Union. It is also a member of the G20. It is also one of the most developed countries in the world. According to data World Bank in 2019, Italy was 27th in the world in terms of GDP per capita (after taking into account purchasing power parity). However, the splendor of the Italian economy has faded significantly since the beginning of the XNUMXst century. The era of the Italian economic miracle is forgotten. However, it is not an "open-air museum" in Europe. On the Italian stock exchange, you can still buy shares of companies with an interesting business model, which are a "determinant" of quality in a given market. A great example are Ferrari cars. Italy is also one of the most important capital markets in Europe. Of course, not as important as the market niemiecki or Britishbut still included in the strict "top".
The most significant index on the Italian Stock Exchange is FTSE MIB (FTSE Milano Indica di Borsa). It groups together 40 of the largest and most liquid Italian companies listed on the Milan Stock Exchange. FTSE MIB like SMI index does not include dividends. For this reason, it should not be directly compared to DAX indexthat reinvests dividends. The 5-year rate of return of the index was around 5,4% (as of April 30, 2021).
The companies included in the FTSE MIB index represented 80% of the entire capitalization of companies and 90% of the turnover on the Milan Stock Exchange. Index shares are calculated based on free float market capitalization. At the same time, the maximum share of one company in the index was set at 15%. It is also worth remembering that the composition of the index is revised once a quarter.
FTSE MIB - a historical overview
The history of the index goes back to the end of 1992, when the COMIT 30 index appeared. The index was not created by the stock exchange but by Banca Commerciale Italiana (Intesa Sanpaolo). It was not until October 1994 that the Italian stock exchange acquired the rights to the COMIT 30 index and renamed it the MIB 30 index (with an initial value of 10 points). Another breakthrough in the index's history was the partnership between Borsa Italiana and Standard & Poor's. As a result, the S&P MIB index was created, which operated in the years 000-2003. The number of index components increased to 2009 companies. Only the takeover of the Italian stock exchange by the London Stock Exchange changed S&P MIB to FTSE MIB. The last takeover of the Italian stock exchange took place in 40, when Euronext came under the wings. However, there are no major changes to the index for the time being.
FTSE MIB chart
The FTSE MIB index shows the condition of the largest Italian companies listed on the Milan Stock Exchange. The index is influenced by the financial results of the components (companies). Some of them focus mainly on the Italian market, but part of the FTSE MIB index are enterprises with highly diversified revenues geographically.
Index composition
According to data provided by FTSE, the FTSE MIB index has 40 components. At the end of April 2021 the largest component of the index had a capitalization of € 57bn. The median value of the companies included in the index was € 4,9 billion. Meanwhile, the average capitalization was € 9,5bn.
The index is quite concentrated. The 10 largest index components accounted for over 66% of the weight of the entire index. The largest component is Enel with a 15% share in the entire index.
The index is highly concentrated in terms of sectors. The companies associated with the financial industry (30,7%). The next in terms of size is utility industry (19,3%) and companies with automotive sector (13,8%). Industry of companies included in modern technologies is responsible for 5,3% of the index (one company).
At the end of April 2021, the following companies are the largest components of the index:
- Enel
- Intesa Sanpaolo
- Stellantis NV
- Eni
- Ferrari.
Below is a brief overview of several of the companies included in the FTSE MIB index.
Amplifon
The company was founded in 1950 in Milan by Algeron Charles Holland. The company provides products that improve hearing (including hearing aids). The company has over 11 points of sale in 000 countries around the world, spread over 26 continents. The company employs over 5 people. In addition to hearing aids, the company also offers accessories (also from other companies) supporting the operation of hearing aids (e.g. wireless transmission of sound from devices with bluetooth to hearing aids). The main shareholder is Ampliter Srl, which holds 17% of the capital and 000% of the votes. It belongs to the family of the company's founders. The company's current capitalization exceeds € 42,2bn.
| € million | 2017 | 2018 | 2019 | 2020 |
| revenues | 1 266 | 1 362 | 1 732 | 1 556 |
| Operational profit | 150,8 | 154,2 | 178,7 | 172,0 |
| Operating margin | 11,91% | 11,32% | 10,32% | 11,05% |
| Net profit | 100,6 | 100,4 | 108,7 | 101,0 |
Source: own study
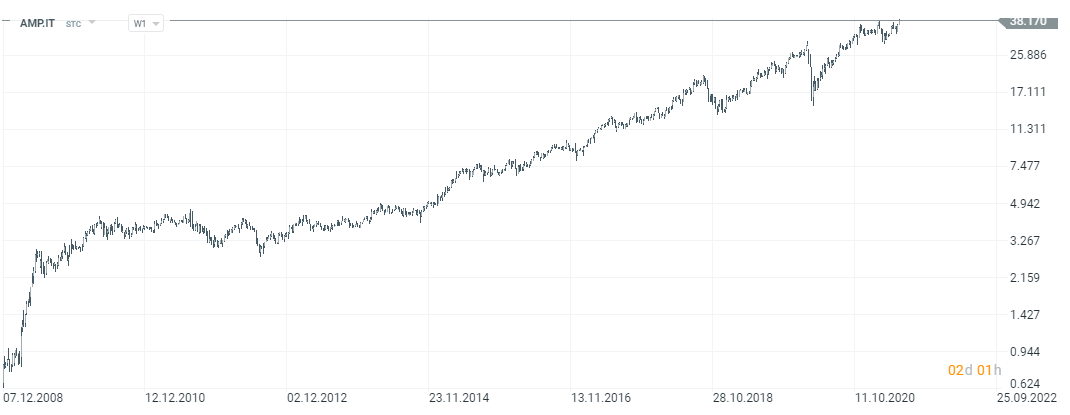
Amplifon stock chart, interval W1. Source: xNUMX XTB.
Ferrari
The company's history dates back to 1939, when the company was founded by Enzo Ferrari after leaving Alfa Romeo. Half of the shares in 1969 were acquired by another Italian car company - Fiat. Fiat's stake in Ferrari increased to 90% in 1988. In 2014, it was spun off from Fiat Chrysler, and a year later it debuted on the New York Stock Exchange. The company is also listed on the Milan Stock Exchange. The company's products do not need to be introduced to anyone - they are famous luxury cars. The Ferrari family still owns 10% of the company's shares. Ferrari NV's capitalization is around € 43bn.
| € million | 2017 | 2018 | 2019 | 2020 |
| revenues | 3 417 | 3 420 | 3 767 | 3 460 |
| Operational profit | 779,8 | 827,0 | 918,9 | 730,0 |
| Operating margin | 22,82% | 24,18% | 24,39% | 21,10% |
| Net profit | 535,4 | 784,7 | 695,8 | 607,8 |
Source: own study
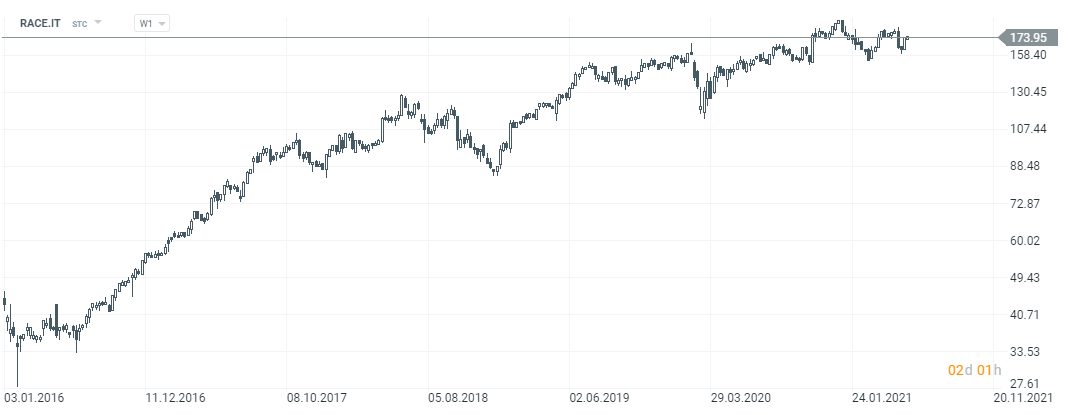
Ferrari stock chart, interval W1. Source: xNUMX XTB.
Moncler
It is an Italian manufacturer of luxury clothes and accessories. The brand is very recognizable as a producer of high-quality winter clothes (jackets). The history of the company dates back to the beginning of the 2s. The company's first headquarters was in Monestier-de-Clermont, near Grenoble. The company's fame was achieved by Lionel Terray's expedition to K1954 in 2003. This climber has reached the top of the mountain in the Moncler Jacket. The company was famous for combining high-quality products with fashionable design. The company, however, struggled to achieve profitability. In XNUMX the brand has been taken over by Remo Ruffini, who saved the company from bankruptcy. In 2013, the company made its debut on the Milan Stock Exchange. After transformation, the company became one of the most famous fashion brands in the world. The company generates about half of its revenues on the Asian market. The Italian market is responsible for around 10% of revenues. The company's capitalization is just over € 15,3 billion.
| € million | 2017 | 2018 | 2019 | 2020 |
| revenues | 1 194 | 1 420 | 1 628 | 1 440 |
| Operational profit | 340,9 | 414,1 | 491,8 | 368,8 |
| Operating margin | 28,55% | 29,16% | 30,20% | 25,61% |
| Net profit | 249,7 | 332,4 | 358,7 | 300,4 |
Source: own study
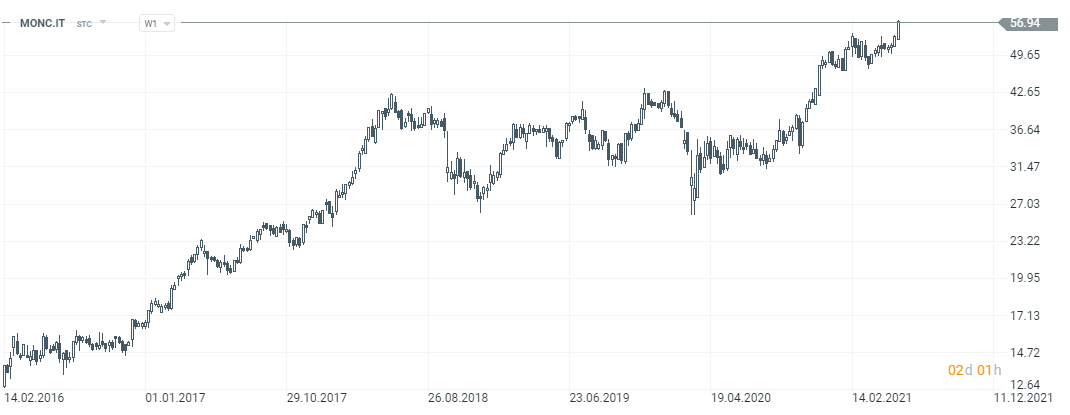
Moncler stock chart, interval W1. Source: xNUMX XTB.
Pirelli
It is the seventh largest tire manufacturer in the world. It mainly focuses on the production of tires for cars, trucks, motorcycles and bicycles. The company sells its products in over 160 countries around the world. It also has 19 factories in 13 countries. In 2015, the company was sold for over € 7 billion to the Chinese company ChemChina. The company's CEO is Marco Tronchetti Procera, who through CAMFIN controls 10,1% of the company's shares. Pirelli's largest shareholder is ChemChina, which holds over 45% of the capital. The capitalization of the Italian company is € 4,8 billion.
| € million | 2017 | 2018 | 2019 | 2020 |
| revenues | 5 352 | 5 194 | 5 323 | 4 302 |
| Operational profit | 753,2 | 727,5 | 774,0 | 237,6 |
| Operating margin | 14,07% | 14,00% | 14,54% | 5,52% |
| Net profit | 176,4 | 431,6 | 438,1 | 29,8 |
Source: own study
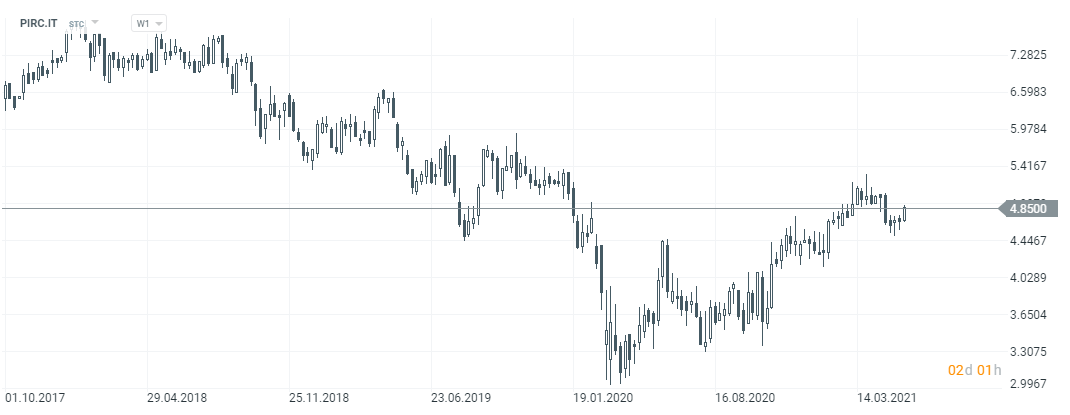
Pirelli stock chart, interval W1. Source: xNUMX XTB.
Snam
It is an Italian company related to the gas transmission industry. Snam is the main Italian operator of the gas transmission network. The company has over 32 thousand. kilometers of gas lines in Italy and several thousand in foreign roars. The company also offers gas storage and regasification services. The company has been listed on the Milan Stock Exchange since 2001. Currently, the company's largest shareholder is CDP Reti, which is a joint venture of the state-owned bank CDP and the Chinese state-owned company SGCC (State Gird Corporation of China). CDP Reit owns approximately 29% of the company's shares. Snam's market cap is just under € 15,8bn.
| € million | 2017 | 2018 | 2019 | 2020 |
| revenues | 2 517 | 2 586 | 2 665 | 2 770 |
| Operational profit | 1 360 | 1 392 | 1 482 | 1 407 |
| Operating margin | 54,03% | 53,83% | 55,60% | 50,79% |
| Net profit | 897 | 960 | 1 093 | 1 104 |
Source: own study
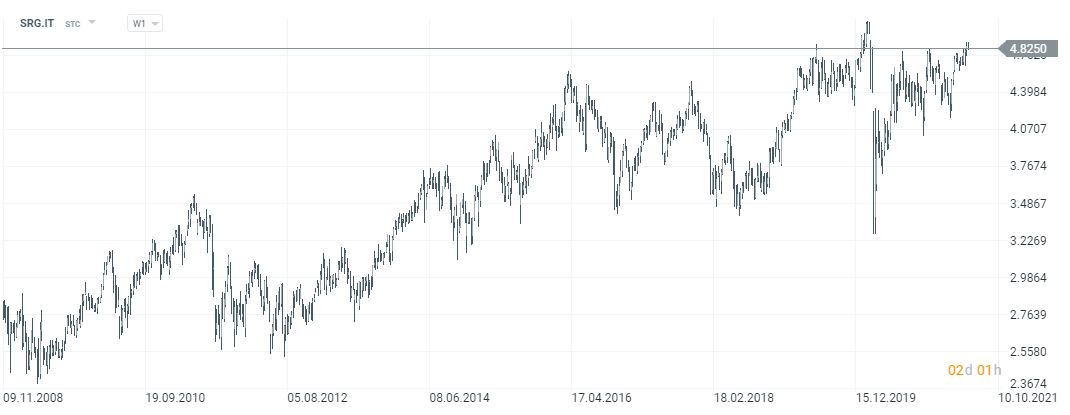
Snam stock chart, interval W1. Source: xNUMX XTB.
What may affect the value of the FTSE MIB index?
The condition of the Italian and world economy
The FTSE MIB index brings together 40 of the largest companies listed on the Milan Stock Exchange. Some companies operate mainly on the Italian market. An example is the Italian banks that are components of the index. An example would be Banca Milan, Intense Sanpaolo or Banco BPM. On the other hand, they constitute a significant part of the index companies with the majority of revenues outside Italy. An example would be Amplifon or Moncler. For such companies, the condition of the world economy matters more than the economic performance of Italy.
Financial results of companies
In the long term, the rate of return on company stocks depends on the company's ability to generate additional added value. This will entail an increase in intrinsic value. For this reason, improving the financial performance of the FTSE MIB components is expected to contribute to the long-term growth of the index. On the other hand the deterioration of the financial results of Italian companies negatively affects the value of the index.
Central bank policy
The weaker euro supports export-oriented companies as the companies' products become more attractive on the global market. Also, low interest rates help companies refinance their debt (reduce financial costs) and allow them to obtain cheap capital for acquisitions or investments. An increase in interest rates may increase the financial costs of enterprises in the long term, which may adversely affect the condition of the most indebted companies. The rise in rates also translates into a higher expected rate of return for investors, which is causing the "multipliers" to "drop," and with them valuations.
How to trade the FTSE MIB index
Futures contracts
An investor can gain exposure to the FTSE MIB index through an acquisition futures contract futures on the index. He can buy either the standard index (with a face value of over € 125) or the micro version with a value of 000/1 of the base contract. However, keep in mind that a smaller futures contract has much less liquidity.
The FTSE MIB is one of the best-known European index futures. However, it is not as popular as 100 FTSE or DAX.
The value of one point is € 5. At the current value of the index - around 25 points, this gives a nominal contract value of € 000.
You can trade indices expiring in the next 4 quarters (March, June, September, December). The indices expire on the third Friday of the contract delivery month. The delivery is made in cash.
"Mini" futures contract
There is a "micro" version of futures on the market, with 1 point worth € 0,2. With an index value of 25 points, this gives you a nominal contract value of just € 000. On May 5000, the June contract could boast an LOP of less than 21 units and a daily turnover of 2000 units.
This move allows investors with a much smaller investment portfolio to trade futures as well. One point of this futures contract is priced at € 1. Consequently, the face value of the contract is € 25.
However, it is not a very popular futures contract. As of May 21, the number of open contracts (LOPs) for the June series is over 11. For comparison, the "normal" June contract has LOP at the level over 97 thousand pieces.
Options on FTSE MIB
Trading is also possible options on the FTSE MIB index. They have a European style of execution and their face value is equal to the value of the futures contract (multiplier of € 5). It is possible to trade both options with a month-to-date (the 3 closest) and quarterly (currently until June 2022) options. At the same time, there are options that expire in December 2022-2027. In addition, there are also weekly options (the next 2 weeks).
CFDs on FTSE MIB
Investors can also speculate on the price of the Italian FTSE MIB index on brokerage platforms by buying and selling CFDs (for the difference in price) in real time. CFDs offer traders a leverage that allows you to engage only a portion (typically 10% / lever 1: 10) the required deposit.
Popular brokers offering FTSE MIB
Below is a list of the most popular ones Forex brokers offering the best conditions for CFDs on the Italian Stock Index.
| Broker |  |
 |
|
| End | Poland | Cyprus / Australia / Mauritius | Great Britain, Cyprus |
| FTSE MIB symbol | ITA40 | IT40 | ITALY40 |
| Min. Deposit | PLN 0 (recommended min. PLN 2000 or USD 500, EUR) |
200 USD | PLN 100 |
| Min. Lot value | price * 5 EUR | price * 1 EUR | price * 1 EUR |
| Commission | - | - | - |
| Platform | xStation | MT4 / MT5 / cTrader | MT4, MT5 |
CFDs are complex instruments and come with a high risk of losing money rapidly due to leverage. From 72% to 89% of retail investor accounts record monetary losses as a result of trading CFDs. Think about whether you understand how CFDs work and whether you can afford the high risk of losing your money.
ETFs
Another option is to acquire companies included in the index. However, it takes considerable capital to reflect the entire index. The alternative is to select 3-6 "best" index components. However, this means that the investment performance may differ significantly from the index 'rate of return.
You can also get exposure to the FTSE MIB by purchasing ETFs with exposure to the Italian market. An example would be iShares MSCI® ETF. The assets under the management of the ETF amount to approximately € 590 million. The benchmark for the ETF is the MSCI Italy 25/50 Index. TER (total expense ratio) is equal to 0,51%. The ETF replicates physically, which is why the 26 leading Italian companies are components of the ETF.
Brokers offering stocks and ETFs
For example on XTB Today, we can find over 3500 equity instruments and 400 ETFs, a Saxo Bank over 19 companies and 000 ETF funds.
| Broker | |
||
| End | Poland | Denmark | Cyprus * |
| Number of exchanges on offer | 16 exchanges | 37 exchanges | 24 exchanges |
| Number of shares in the offer | approx. 3500 - shares circa 2000 - CFDs on shares |
19 - shares 8 - CFDs on shares |
approx. 3 - CFD on shares |
| The amount of ETF on offer | approx. 400 - ETF approx. 170 - CFD on ETF |
3000 - ETF 675 - CFD on ETF |
approx. 100 - CFD on ETF |
| Commission | 0% commission up to EUR 100 turnover / month | according to the price list | Spread depends on the instrument |
| Min. Deposit | PLN 0 (recommended min. PLN 2000 or USD 500, EUR) |
0 PLN / 0 EUR / 0 USD | PLN 500 |
| Platform | xStation | SaxoTrader Pro Saxo Trader Go |
Plus500 platform |
* PLUS500 CY offer
CFDs are complex instruments and come with a high risk of losing money rapidly due to leverage. From 72% to 89% of retail investor accounts record monetary losses as a result of trading CFDs. Think about whether you understand how CFDs work and whether you can afford the high risk of losing your money.


")


Leave a Response