Technical analysis - figures and line formations

- identifying the trend,
- continuation of the trend,
- reversing the trend,
- reversing or continuing the trend.
Technical Analysis: Patterns that identify the trend
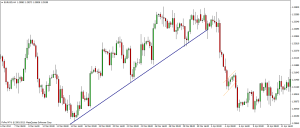
Trend line
It is one of the simplest and most important tools that technical analysis uses. Trend line is used to determine the directional trend (in different time periods). The upward trend is determined by ever higher local price lows. They can be connected by a straight line with an ascending slope (it must have at least two common points). At the same time, such a line supports the growth, the breaking of which may indicate the end of the upward movement or its slowing down. The situation is similar in the case of a downtrend, which is marked by ever lower local price peaks, and a straight line with a downward slope is treated as a resistance. Breaking it down may indicate the end of the ongoing trend or a reversal of the direction.
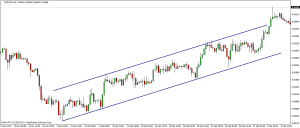
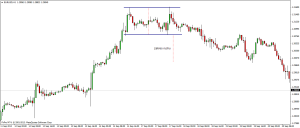
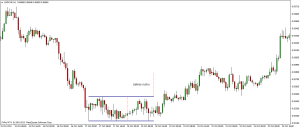
Price channel
The price channel is a tool based on the trend line. It also identifies the directional tendency of the market but at the same time determines the range of traffic in which the course is moving. The channel consists of two straight lines parallel to each other, where one runs along local minima and the other at the price maxima of a financial instrument. Usually the breaking of the course heralds a movement corresponding at least to the height of the channel.
There are three types of channels: growth, declining, side (horizontal).
Technical Analysis: Trend Continuation Patterns
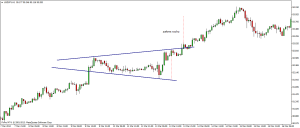
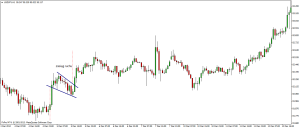
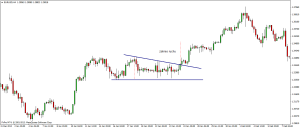
Flaga
The formation of the flag is shaped by two parallel lines that have opposite slopes relative to the prevailing trend (if the trend is upward, the flag channel is directed downwards). This formation is shaped in a relatively short time, and breaking it down towards the previous trend indicates the return of the market to the continuation of this movement. Flags usually appear around half of the clear movements, which is why after breaking the formation you can expect at least the same wave range as before it occurred.
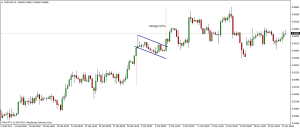
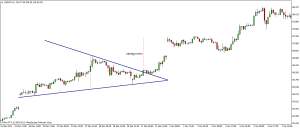
Flag
Formation is plotted by two converging straight lines that look similar to the isosceles triangle. Like flags, they take shape in a fairly short period and appear more or less in the middle of strong movements of the price of a financial instrument. The expected range of movement after breaking is usually the same as the previous wave before formation.
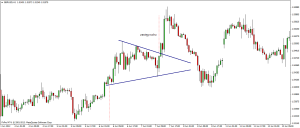
Klin
The wedges resemble triangles. They consist of two converging lines that are sloping in the same direction but in the opposite direction to the ongoing trend. They usually take longer than the two previous formations, but just like them, they occur in the middle of the dynamic movement and the expected range of movement after breakout from the formation is as much as the previous wave before the wedge.
Technical Analysis: Trend Reversal Patterns
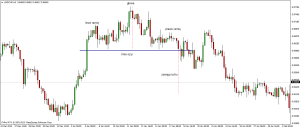
Head and shoulders
It is one of the most reliable and popular formations in classical technical analysis. The name of this formation derives from the deceptively human silhouette, where the graph shows three local peaks with the highest one in the middle and two lower peaks at a similar level on the sides. The theoretical extent of the downward movement is determined by measuring downwards the same distance as from the head line to the neck line. A fairly important element is the distribution of the transaction volume, where the market should be most active at the left shoulder and at the top of the head, but on Forex market it is difficult to obtain reliable data on turnover, so investors attach less importance to it.
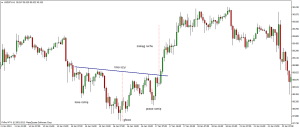
Inverted head and shoulders
This is the reverse formation of the head and shoulders, which occurs in a downward trend and promises a reversal of the directional tendency. The head of the head is the lowest while the arms are at a similar level slightly higher. Similarly, the potential range of motion is the same as the distance between the head line and the neckline.
Double and triple peak
One of the easiest to identify formations. The double peak resembles the letter "M" and consists of two peaks that occurred at a very similar price level. It is in an uptrend and heralds a change in direction to a downtrend. This state of affairs is confirmed by a break below the local low between the two highs. The potential range of motion is equal to the distance between the peaks and the lows. The triple peak formation is characterized by one more peak.
Double and triple bottom
An analogous formation for a double / triple peak. It occurs in a downward trend and promises a reversal of the upward trend. Wells have to occur at a similar level, and the confirmation of formation is a break above the local peak. The same is the potential range of motion.
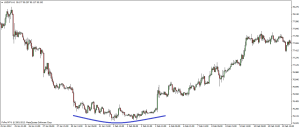
Saucer and inverted saucer
A pattern that occurs in a downtrend that foreshadows its reversal. It consists of a longer consolidation, which resembles a saucer with its rounded shape. The local peak is established more or less in the middle of the move, but the problem is to precisely indicate the place where the rate breaks out of the pattern, which would confirm the change in the trend.
In an upward trend, an analogous formation is an inverted saucer.
Technical Analysis: Patterns of trend reversal or continuation
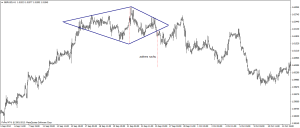
Diamond
The diamond formation consists of a rhombus reminiscent of a diamond and is initially disheveled by the shape of a head with arms. The direction in which the market will follow is determined by the direction of breaking. The potential range of motion determines the vertical distance at the widest point of the diamond and is measured from the point of eruption from the formation.
Rectangular triangle
The rectangular triangle consists of two lines, where one is horizontal and the other has a rising or falling slope. Further direction is determined by the direction of breaking. The range of potential movement is as much as the height of the triangle measured from the point of eruption from the formation. Triangle formations are considered the least reliable in relation to the other ones, however, they are most often found on the charts.
Equilateral triangle
The isosceles triangle consists of two lines converging towards each other. The direction of breakout from the formation determines the further movement to one side. The range of potential movement is as much as the height of the triangle measured from the point of the breakout from the triangle. Triangle patterns are, according to many, the least reliable in relation to the others mentioned, but they most often appear in charts.
Expanding triangle
The formation of the widening triangle consists of two straight lines that have opposite slope directions. The top line is always north and the bottom line is south. The side on which breakout occurs is decisive for the further trend. The range of the potential move is as much as the height of the triangle measured from the breakout point. Triangle patterns are considered the least reliable in relation to the others mentioned, however, they most often appear in the charts.