


False Breakouts - Control of the moves in the Forex market

What we often observe in everyday trade are undoubtedly false strikes. For many traders, they are a source of frustration and nerves, because very often, having a specific plan, observing the levels and deciding to enter a position with the intention of continuing a given move, it turns out that the market misleads us. Thus, breaking the given level / zone turns out to be false.
However, it should be remembered that a good trader learns from mistakes and draws specific conclusions, trying to get as much information as possible about the further direction of the price. Good observation, combined with certain methods, will allow us not only to limit losses resulting from false hits, but also to profit from them.
What is "Dislocation"
The choice is nothing but breaking through the price the key level of support or resistance. On the market, such situations occur constantly, but the key is proper filtering of signals. Most of the hits occur after the consolidation period, when the price for a long time lies in a certain range, which can not be overcome. Such breaks are usually the strongest and they determine the further direction of the price. When determining and observing, it is worth remembering that the market is full of some kind of noise and you should always consider this principle by analyzing lower time intervals.
Techniques that filter false positives
At the beginning it is worth noting that it is not necessary to combine all methods or techniques. How many investors, so many ideas for trading. Before using individual techniques, we always first determine whether they fit into our style of trading. In this article, I will present techniques that I personally use in everyday investing. At first glance, they may look banal, but they have helped me a lot in avoiding false hits and proper filtering of signals.
I. Time interval
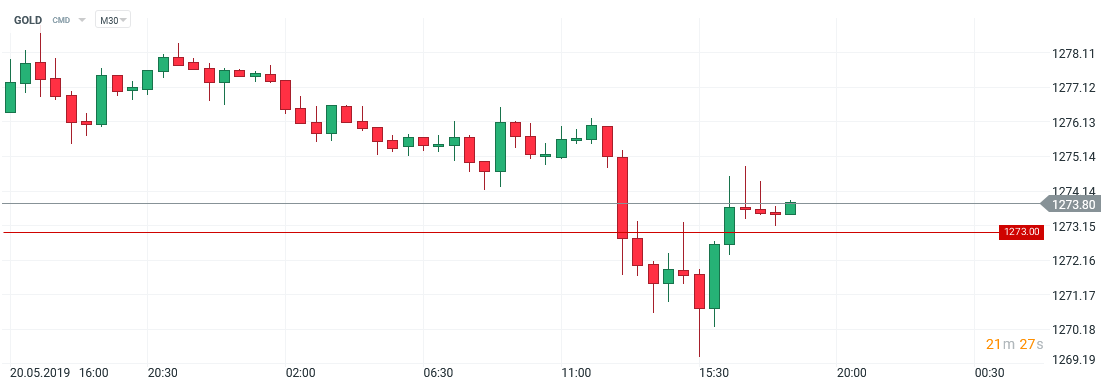
This is the basic thing I use to filter out false positives. The lower time intervals contain more market noise, which, at least for me, has been a problem in the proper selection of signals for a long time. Of course, there is not one best interval, but what is worth keeping in mind is that by defining a given level and observing it from the perspective of different time intervals, the puncture / dislocation looks significantly different. An example may be today / yesterday (depends on when the article will be published) the situation on the gold market.
Be sure to read: We choose the time interval for analysis
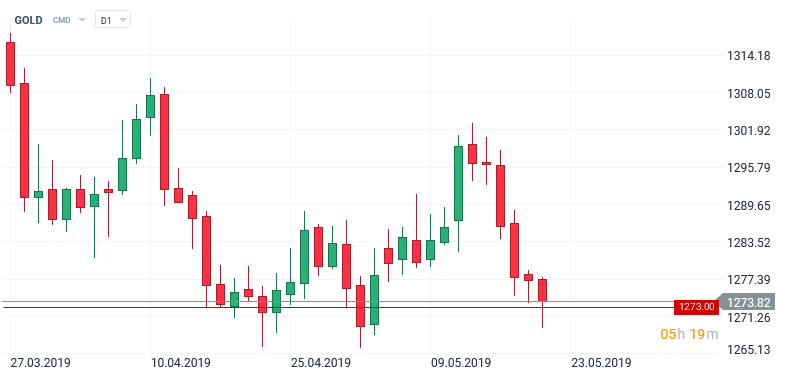
I've defined the key level of support around 1273. As we can see on the M30 chart, there was a breakdown of this level, after which the price returned above. For someone playing at lower intervals, several signals are automatically created to enter the position. Now let's get to the D1 chart. You can see perfectly that the level has been broken, then the price comes back, creating a long bottom shadow. The signal here will only be the closing of the whole candle nad and/ or pod specific level.
II. Use of medium
I am not an advocate of putting different indicators on the 10 chart, but when it comes to determining false hits, the rolling average can be helpful. It does not matter what parameters we use for mediums because the average is a filter for us, not the determinant of entering the position. You can also use the technique of combining two means, if it comes to breakthrough / breaking of the key level, and the averages are distant from each other, it may be a signal for us that it is worth abstaining from entering the position.
Be sure to read: Precision trading - techniques facilitating entry into the transaction
III. Observation of price / retest
The last key aspect is price observation. For me, the determinant of whether the breaking / raising is false is the closing of a given candle. It is also worth paying attention to whether the price within the zone draws shadows. This may give us a hint because shadow is nothing more than a false breakout at a lower time interval, showing the "weakness" of a given side of the market. As for retests, he uses a simple rule - if there is confirmation of a breakout in the form of a candle close, and the price is relatively close to the level, the retest is not necessary. If, on the other hand, we have something like a large swing that strongly breaks a given level, we wait for the price to go lower and, for example, place a pending order closer to a specific zone.


