


What are divergences and how to use them in trading?

What are divergences and how to use them in trading? The vast majority of available oscillators move in the ranges from 0 to 100 or oscillate around the zero point, take once positive and once negative values. It will be natural, then, that the highs and lows of the oscillators will not match those on a graph that has no such limitations. The fact of the occurrence of such anomalies in specific places on the chart, you can effectively use it to look for potential reversals of the trend or the beginning of the correction.
Definition of divergence
The dictionary meaning of the word divergence means discrepancy. In our case it will be a discrepancy of indications between the technical index and the price of the analyzed asset. Sometimes there are situations in which the price reaches a new peak and the oscillator does not reflect this behavior and creates a lower peak than the previous one. We are dealing with divergence, which may herald that we are approaching the actual turning point.
What indicators to use
The most popular indicators used by traders to search for divergence include:
- RSI
- A stochastic oscillator
- MACD
- CCI
Typically, the default platform settings are used when it comes to indicator settingsbut sometimes other traders' preferences are encountered, e.g. often RSI is set to a period of 9 on a daily interval. For example, I use a stochastic oscillator with the parameters (5,3,5) on the daily chart.
For whom divergences are the most useful
Effective capture of turning points can be useful in principle for every trader. However, there is a group for which it will be particularly useful. We're talking about people using a strategy in commerce Swing Trading. This group of traders mainly concentrates on swinging, i.e. capturing the end of corrections. Of course, position players trying to capture the beginning of the trend can also use this tool to effectively and sometimes very precisely join in the emerging trend (see example on USDJPY pair below). In principle, if a tool does not hurt, then in my opinion it can be useful to everyone. Even traders using harmonic strategies they will lose nothing if they receive another confirmation or use divergence, for example to leave the position.
What are the types of divergence
We can distinguish the following divergence types:
- regular
- growth
- succession
- hidden
- growth
- succession
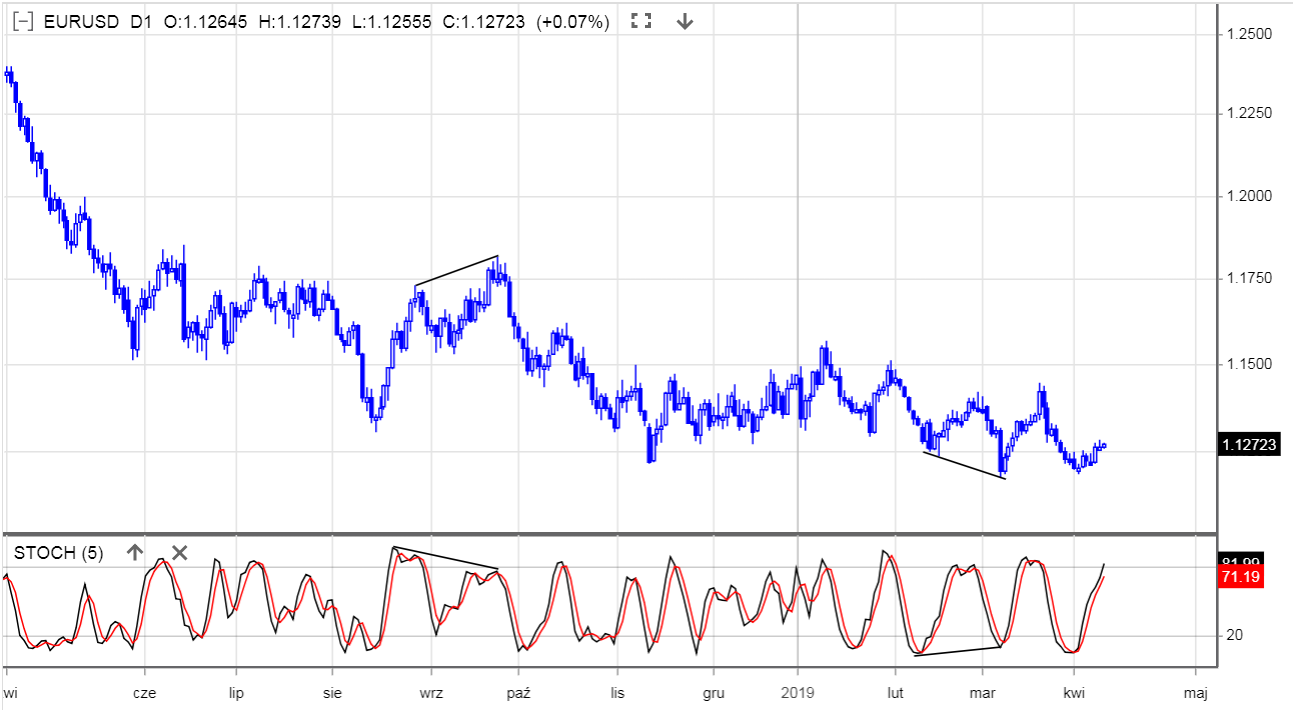
Above, we see regular divergence (on the left) and regular upward divergence (on the right). In the first case, the price reaches a new peak and the oscillator has a lower peak. In the second case, the price reaches a new hole and the oscillator goes higher. This type of divergence is not a signal in itself. You can never be sure whether you are already dealing with the end of the trend (see the example on USDJPY pair below). You should always confirm this divergence. You can do it either by going down one interval and lowering the current trend or wait for a candle (eg pinbar or hammer) at the current interval, which would signal readiness to change the trend by the market.
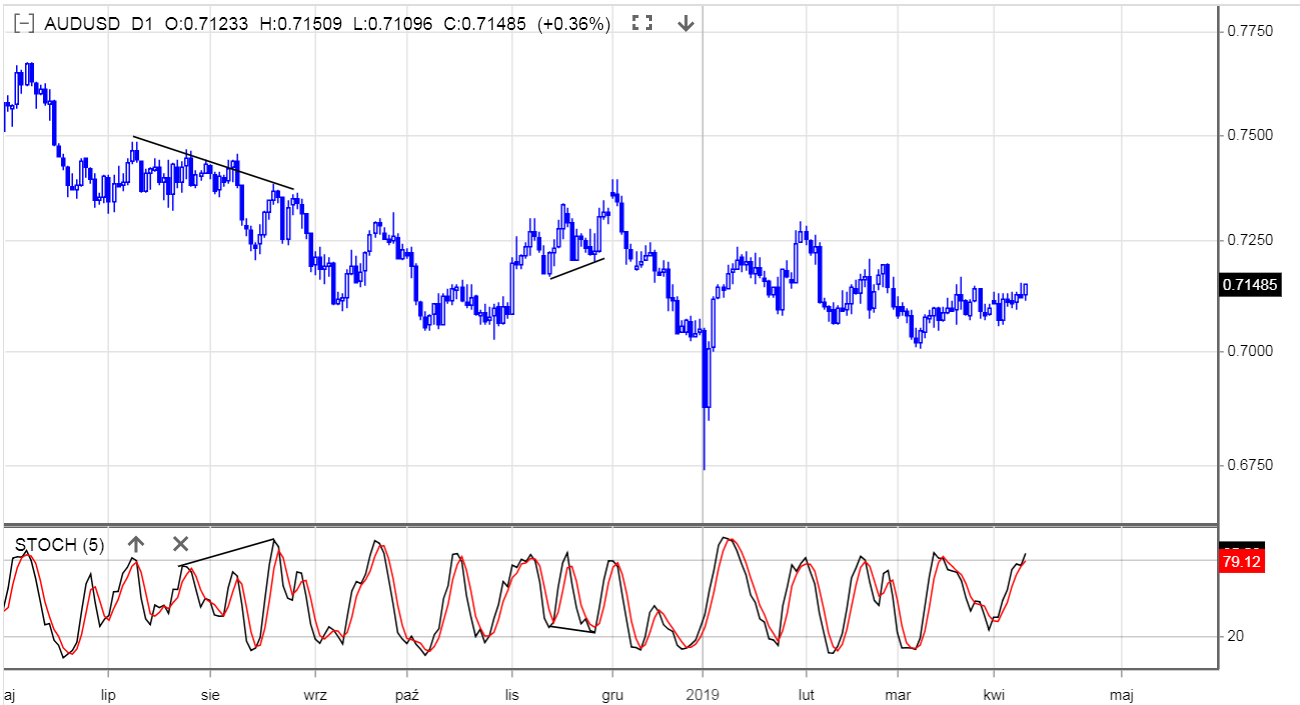
Above we see an example of hidden divergences. In the downward trend, we analyze the highs of the oscillator and in the upward trend, the lows (contrary to the regular divergence). It is easy to see that if the oscillator hits a new low and the price reaches a higher low, you can place a stop loss at the last low. Sometimes such divergences are very valuable confirmation.
Divergences - examples
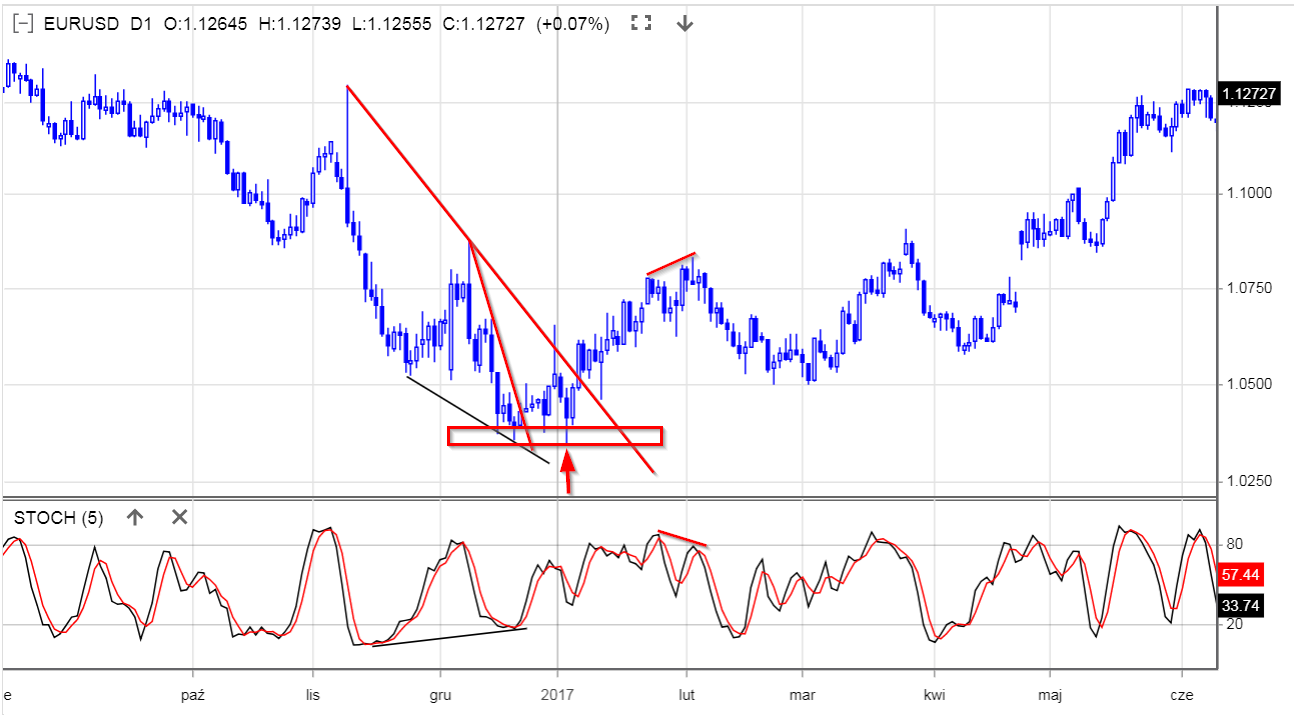
In the chart above, we see that despite the first divergence, it was necessary to wait for the first trend line to break (confirmation of divergence and the possibility of logically placing the stop loss below the last hole) and then to the lower level test marked with an arrow. There, you could open the position with the prospect of rising to the last summit. As we can see, the next divergence at the end of January turned out to be a good signal to get out of the long position.
Above, a very important example illustrating that divergence works, and at the first instance it gave the opportunity to earn several dozen pips on the correction, but what is important in this example is that after the first divergence, it should not be expected to reverse the whole trend. It often happens that the reversal of the trend, especially the medium-term trend, follows the 3 or 4 test of the upward trend line on the oscillator. In this case the reversal took place after the third test. You have to remember this and not be tempted to open unconfirmed transactions quickly.
Analysis of the divergence phenomenon on the stochastic oscillator
As defined in Wikipedia, a stochastic oscillator is based on the observation that during upward trends, closing prices are generally close to the upper limit of their fluctuations, while in downward trends they approach the lower end of this range.
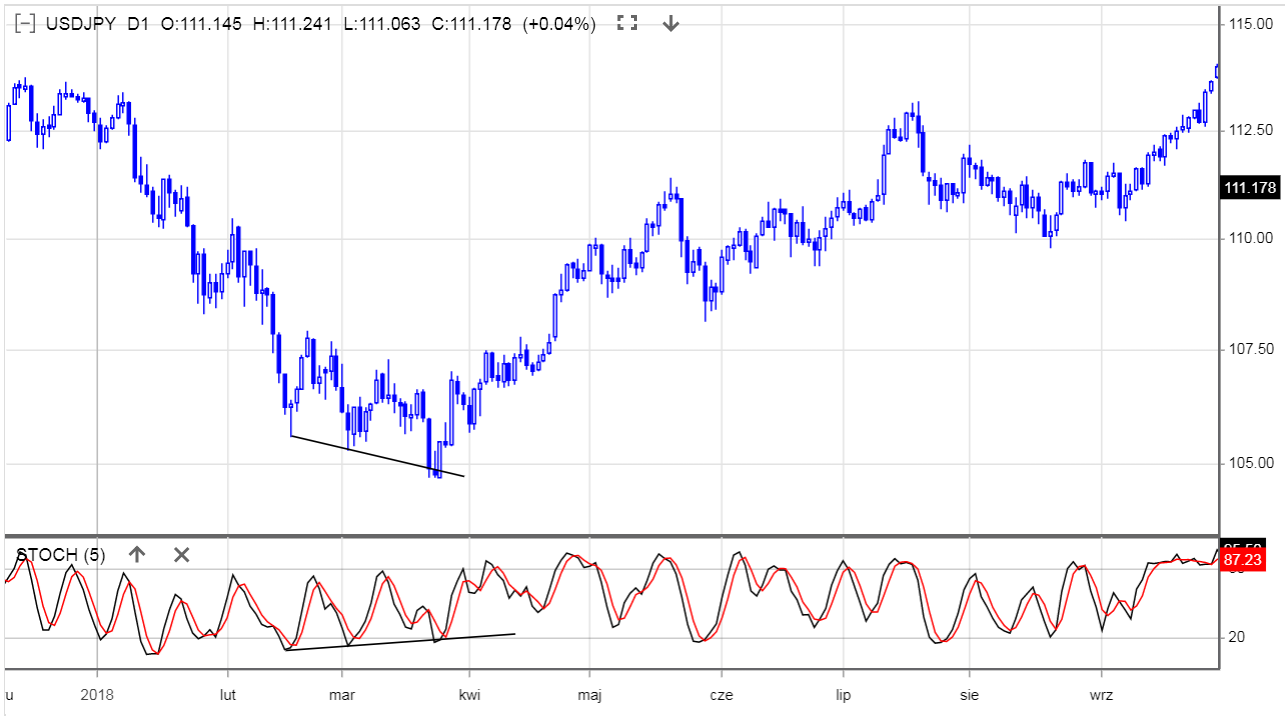
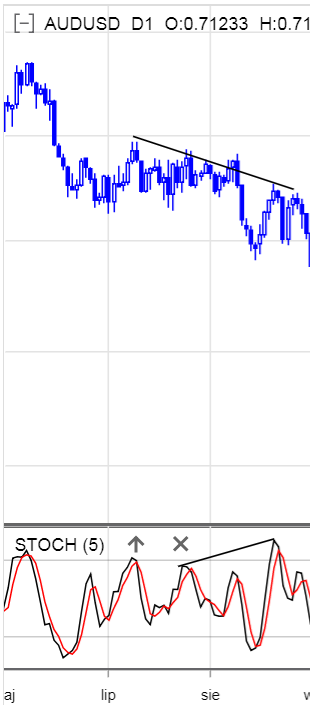 There is a downward trend in the visible divergence. The sudden increase in the ratio from the sell-to-buy-out level is due to the fact that we had here 4 growth candles in a row, where 2 closed at its daily maximum and the other two more than half of the range, which clearly indicated strong demand. Statistically speaking, 4 alone, growth candles in a row and those with such properties are rare on the currency market. I am talking here, of course, about the daily interval.
So we have practically a week of increases, which, however, did not overcome the previous week's downturn. This is what the divergence came from. In comparison to previous increases in this downward trend, these were exceptionally long-lasting and determined. In short: the scale of increases was incomparably higher than before in this trend.
Nevertheless, nothing has changed in the price chart, there has not been a new peak. Divergence was not a signal, but one of his confirmations. At the moment of divergence, the price was on resistance, in a downward trend. All this together gave a solid basis to consider selling this pair.
Is divergence a signal?
No. Divergences are not signals in themselves. The hidden divergences are good because they are in line with the dominant trend but still need confirmation.
Summation
Dividends are a very helpful addition to the transaction system. They are especially useful at higher intervals. They are a warning that there is a kind of non-standard behavior on the market. The proper use of this information can undoubtedly improve our trading results. It should be remembered that, like any other tool, divergences sometimes give wrong signals. Before making any investment decision, the level of acceptable risk and expected profit should be determined.
Do you want to know more about divergences?
Watch Daniel Kostecki's lecture during the seminar FxPro in Warsaw - VIDEO.


