Debt Ceiling and Government Shutdown – Opportunity or Threat for Investors?
The debt limit in the United States has recently been in the media, not only the financial ones. The more catchy headlines threaten the bankruptcy of the United States. This will lead to the so-called Government Shutdown. However, is it really as terrible as the media portrays it? Or is it an opportunity to selectively select overpriced companies? In this article, we will briefly introduce you to what it is Debt Ceiling and Government Shutdown.
The debt limit is made of rubber
The media likes to heat things up. However, the truth is that the debt limit has already been raised over 70 times. Most of the time it was easy to lift. However, there have been situations where this has been a political dispute. The longer such a dispute lasts, the more insecure investors feel. Sometimes a political conflict turns out to be insoluble. As a result, the government does not have the resources to finance its activities. Then we are dealing with a government shutdown, i.e. Government Shutdown.
A Brief History of US Debt
To better understand the whole picture, we need to go back to not so distant history. Before World War I, the U.S. government's borrowing was not easy. Each time the government had to convince Congress to take out a new loan. It was very inconvenient, but no political party wanted to pass for it "uneconomical". In those days, government debt was nothing to be proud of, to put it mildly.
World War I changed the situation. In 1917, the United States entered the war against the Central Powers. Under existing law, any debt-financed expenditure had to be approved by Congress. At the time, it was an unnecessary waste of time. Politicians agreed to the enactment Second Liberty Bond Act from 1917. It authorized the government to issue war bonds. At that time, the upper debt limit was set at $ 15 billion. This gave the government freedom to finance the war effort.
The war ended after a year, but the limit was not lifted. It is worth remembering, however, that the post-war period was very good for the American economy. It was time “The Roaring Twenties". The American government did not have to worry about the deficit. At that time the federal government recorded budget surpluses in each of the fiscal years of the period 1920 - 1930. The US then reduced the federal debt. High tax revenues helped. Fiscal year 1927 was particularly good, ending with a surplus of over $1,1 billion. He broke the good times Great Depression. It led to unprecedented unemployment and a contraction of budget revenues. In 1933, federal revenues were only half of what they had been before the Depression.

FD Roosevelt - the face of the New Deal. Source: wikipedia.org
New Deal changed the rules of the game. From now on, the "night watchman state" has gone down in history. Instead, broadly understood interventionism was introduced. Public Works and successive government agencies sprang up like mushrooms after the rain. This meant that the government had to finance its expenses with a deficit. This one grew to very high levels. In 1936, the deficit was over $4,3 billion with revenues of $3,9 billion. Debt to GDP was then 40%. In the following three years, the deficit was between 2% and 5% of GDP. In fiscal year 1939, the debt was about $40 billion, or 43% of GDP.
It was in this year that another act regulating debt was introduced. She was him Public Debt Acts from 1939. According to the new law, a limit was set for the entire public debt. In 1941, the debt limit was raised to $65 billion.
1941 – 1979: War and the collapse of the Bretton Woods system
Joining World War II on the side of the Allies meant that the United States again had to significantly increase spending. The deficit grew more and more, along with the debt limit, which was raised every year. In 1945, its limit was set at $300 billion. Debt to GDP then reached 112% of GDP. It was an astronomical debt for those times. This forced the political elite to manage public finances more conservatively. To force the government into debt relief, the debt limit was reduced to $275 billion.
Helped to reduce debt post-war economic expansion. The countries of Europe, recovering from the devastation of war, needed literally everything. This meant that there was a simultaneous increase in tax revenues with a reduction in public spending (mainly for the army). There was a rapid decline in debt to GDP ratio. Even the Korean War did not increase the debt. South Korea's defense expenditures were mainly financed by taxes.
The period up to the collapse of the Bretton Woods System was a time of low deficits. Debt grew slower than GDP growth. This made it possible to reduce the debt-to-GDP ratio. In 1974 it was 24,6%. In 1963, the debt limit was reduced for the last time.
In 1974 it was enacted Congressional Budget and Impoundment Control Act of 1974 – it was supposed to facilitate the processing of the deficit. In practice, it facilitated the creation of budgets with a larger deficit. In the analyzed period, the debt limit was raised 41 times.
1980–1992: Reganomics and the end of the Cold War
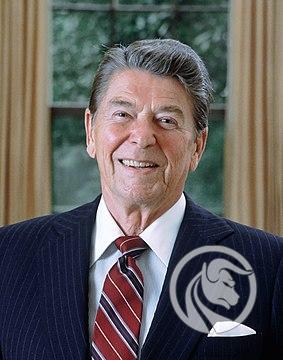
Ronald Reagan. Source: wikipedia.org
The debt explosion was partly related to the abandonment of the gold standard. The US, by suspending the convertibility of the dollar to gold, did not have to worry about the deficit. At least as long as demand for the dollar remains high. Initially, deficits in the 70s were under control. However, there was a problem stagflation. This caused that liberalization of the economy and departure from Keynesianism became more and more fashionable. The era of monetarism and neoliberalism had begun. During the presidency of Ronald Reagan, there was a reduction in taxes (top threshold lowered from 70% to 28%). At the same time, military spending was increased. This led to an increase in debt to GDP from 26,2% to 40,9%. Despite the end of the Cold War, the deficit continued to grow. In 1992 it was already 48,3%.
At that time, there were further increases in the debt limit. The largest in the years 1980 - 1992 took place in 1990. Then the deficit was raised by more than $900 billion. The reason was the Gulf War. The US needed funds to fund Desert Storm. It is worth remembering that despite the good condition of the American economy, there was a debt limit crisis. The lack of compromise resulted in the Government Shutdown.
Between January 1980 and December 1992, the debt limit was changed as many as 23 times. This is much more often than once per calendar year. There were numerous Government Shutdowns during this period, but they lasted only a few days at most.
1993 - 2008: From Clinton to the subprime boom
The economic boom of the 90s caused budget revenues to increase. At the same time, there was a tax increase during the Clinton tenure. As a result, there was a slow reduction of debt to GDP. In 2001, the debt to GDP ratio was 33%.
In the following years, the deficit grew driven by tax cuts (according to GW Bush's program) and the wars in Iraq and Afghanistan. Between 2001 and 2008, debt almost doubled from $3,3 trillion to $6,3 trillion. Despite the increase in the debt itself, there was no significant problem with raising the debt limit. The US economy seemed strong and the debt-to-GDP ratio was at decent levels (around 60% of GDP).
However, under the façade of "stability" he was hiding The black Swan. He was subprime mortgage market i collapse of Lehman Brothers. The financial crisis caused an increase in public debt. The government tried to save many endangered institutions. Falling incomes, resulting from lower profits of American corporations and rising unemployment, were also a problem. Between January 1993 and December 2008, the debt limit was raised 11 times. The last time in October 2008 (by $700 billion). The reason was the aid package for American companies.
Since 2009: The world after the crisis and COVID
Since the bursting of the US real estate bubble, there has been an unprecedented increase in US debt. The increase in debt caused one rating agency to downgrade the US rating from AAA to AA+ in 2011. Despite this, neither Republicans nor Democrats were going to introduce significant austerity measures. Debt rose above 100% of GDP. It was high level, but under control. There were chances of lowering this indicator as a result of faster economic growth. The high level of debt stopped the Democrats from introducing a larger social net.
Just when debt seemed to be under control, COVID-19 happened. Shutting down the economy in China or the United States has disrupted supply chains. This led to a significant decline in GDP. The government intervened with incentives for businesses and citizens. As a result, debt to GDP exceeded 120% of GDP.
Since the outbreak of the crisis in 2007-2009, the political class has been much worse at dealing with political compromises. As a result, there were 4 major debt limit crises (2011, 2013, 2021, 2023). In addition to this, there were two more significant “government shutdowns” (2013, 2018). It can be seen that American politicians have started to approach the negotiations on the budget and the debt limit much more sharply.
From January 2009 to May 24, 2023, there were 12 increases in the debt limit (including some technical ones). The last increase in the debt limit took place in October 2021. The limit was set at $31 billion.
Currently, there is another version of the theater that it is debt limit (debt ceiling). If we look at the chart below, we can see that there have been more than 1972 increases in the debt limit since 50. So this is not something new. You can clearly see the period from 2017 to 2021. Over the years, the debt limit has increased by $13,3 trillion.
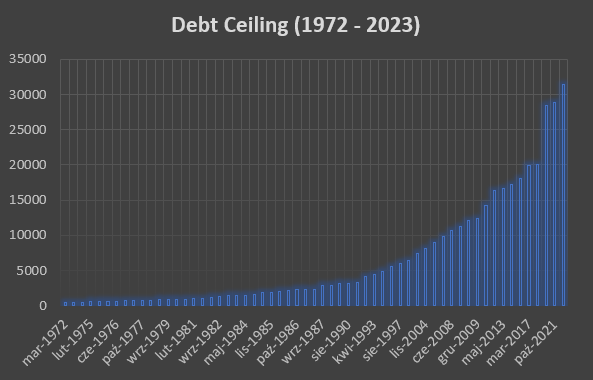
source: own study
As you can see from the history of US debt, the debt limit itself is not a new phenomenon. It appears very often. The media is interested in him only when the parties to a political dispute cannot reach an agreement. This is where the political theater begins and the exchange of “niceties” between Democrats and Republicans begins.
It is important to remember that the US debt level itself is high, but there are countries in the world with much higher levels of debt. As an example can be given Japan, whose debt to GDP ratio exceeds 260%. Some countries have similar debt levels. An example can be given of France, where the debt to GDP ratio is over 111%.
Government Shutdown - Fear has big eyes
Investors are not primarily afraid of the debt limit itself, but of a scenario in which Democrats and Republicans are unable to get along. After exceeding the debt limit, the country can no longer incur new liabilities. Considering that a significant part of expenses is financed from debt, this limit makes savings necessary. The government goes into austerity mode. Some employees go on vacation. This does not mean that the state does not function. The courts, the FBI, the CIA, the military are still operating. National parks and museums are closed. In addition, some officials do not perform their functions. As a result, some official matters will not be dealt with during Government Shutdown.
The GAO.gov website has a graphic that perfectly illustrates the title phenomenon. It shows that a government shutdown is not commonplace. Since 1993, it has only happened in three fiscal years: 1995/1996, 2013/2014 and 2018/2019. The longest government shutdown lasted 35 days.
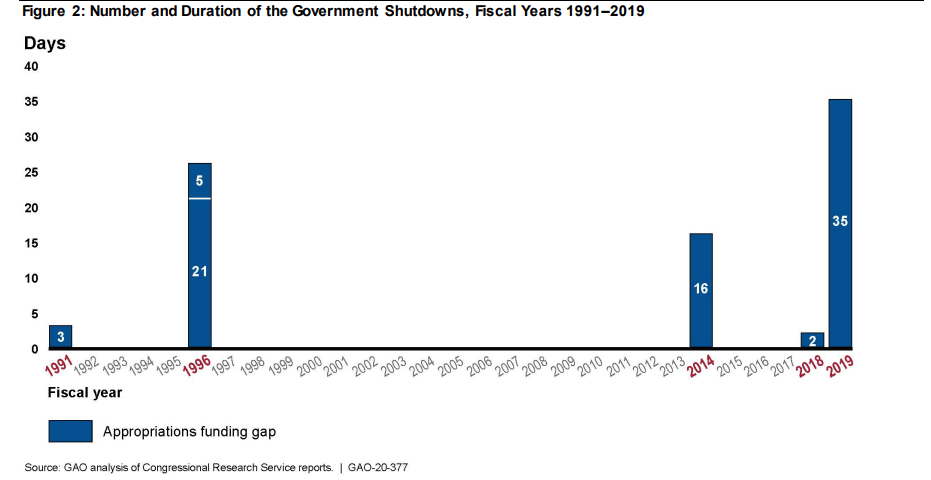
Periods and number of government shutdowns. The chart shows fiscal years, not calendar years. Source: GAO.gov
How is the stock market reacting to Government Shutdown?
It is worth looking at the issue related to the political crisis from the point of view of investors in the stock market. Theoretically, it seems that such a situation should cause a sharp sell-off in the stock market. Was it really like that?
We will look at the three most serious crises related to the cessation of the functioning of some government agencies:
- 1995 / 1996,
- 2013 / 2014,
- 2018/2019.
Can 1995/1996
The mid-90s was a golden age for the United States. The country won the Cold War and became an undisputed economic, military and political power. Even then, however, the political dispute led to one of the longest shutdowns of the US government. It took place at the turn of 1995 and 1996. Then the offices were closed twice. First time between 14 and 19 November 1995. Second time between December 16, 1995 and January 6, 1996.

Let's take a look at the situation of investors during the government shutdown. From the low of November 15 to the high of January 8, the S&P 500 rose by 30 points, or about 5%. However, if we look at the period from 1995 to 1997, we realize how insignificant this phenomenon was for the long-term investor.
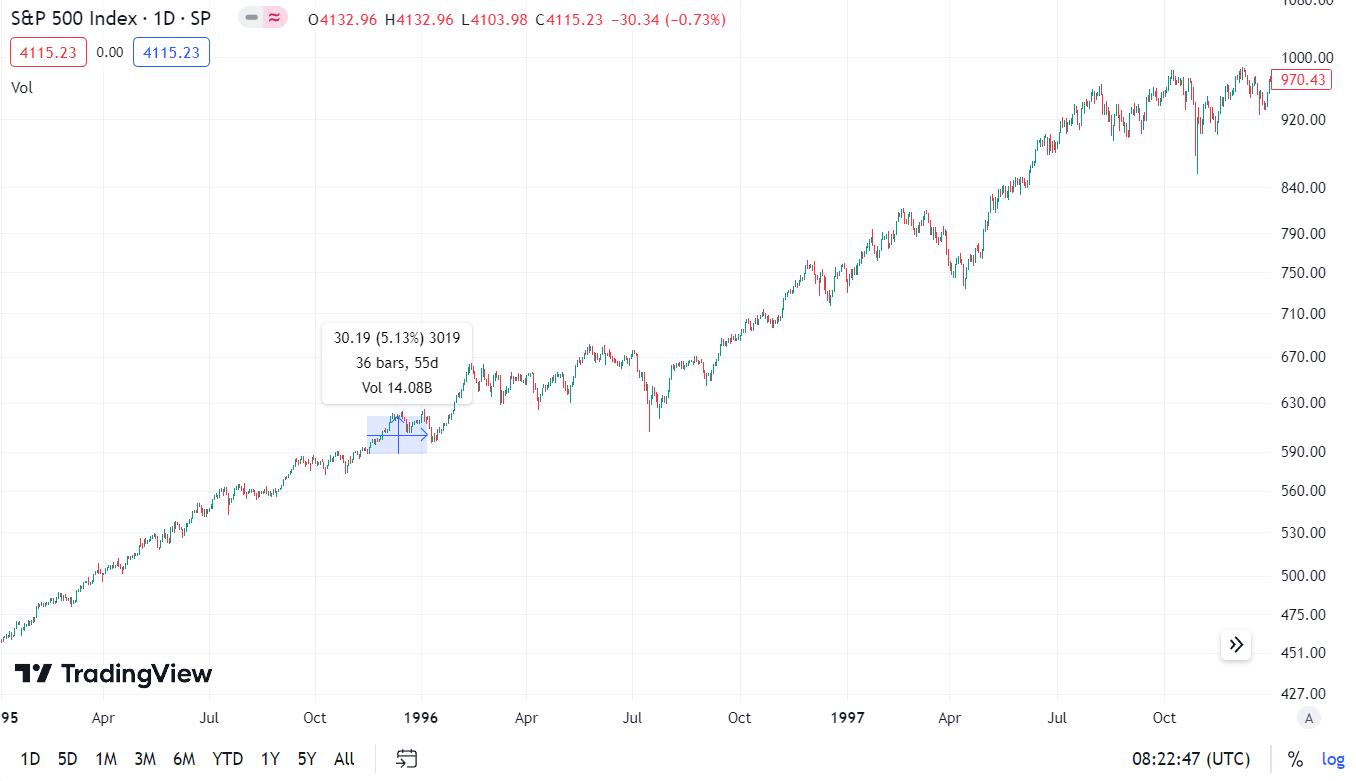
As you can see, if we didn't know when the US government was curtailed, we would probably choose the larger revisions of 1996 and 1997.
The market approached the whole commotion very calmly. No wonder. The United States had a low debt-to-GDP ratio, solid economic growth, and a favorable macroeconomic environment. Moreover, the US was experiencing a technological boom related to the spread of the Internet. The market decided that these were mere political scuffles and not real financial problems.
2013s/2014s
It is the third longest such event in US history (after 2018/2019 and 1995/1996). The period of limiting the functionality of the government itself lasted 16 days. During Government Shutdown 800 federal employees were furloughed. On the other hand, 000 million were obliged to work without specifying the date of payment for the work performed. Then there was sequestration, that is, an automatic cut in federal spending. The stalemate resulted in part from a political dispute. Congress was divided. One house was controlled by Democrats, the other by Republicans. The more conservative wing of the Republicans demanded changes in the Obamacare (significant reduction of its costs). The Democrats disagreed. The shutdown of some institutions lasted 16 days (October 1-17, 2013). Eventually, a compromise was reached between Democrats and Republicans.
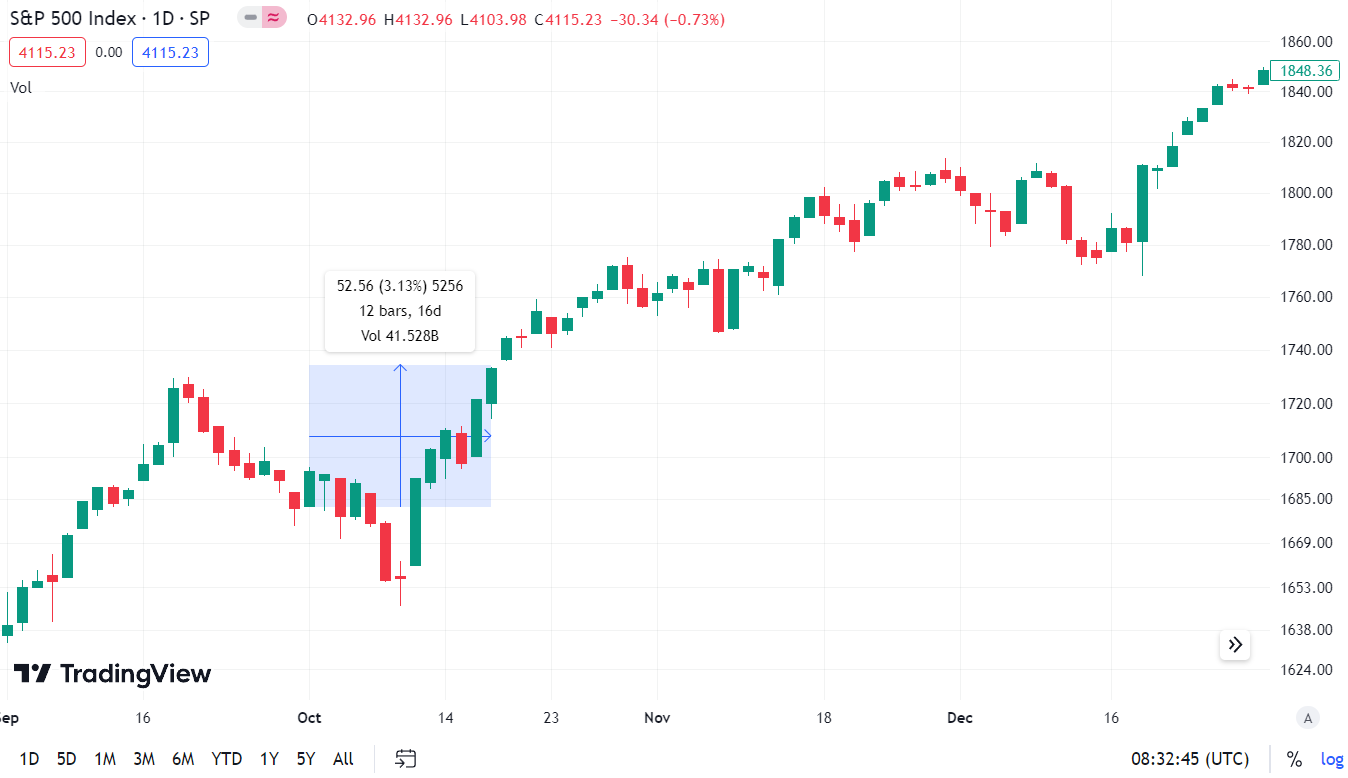
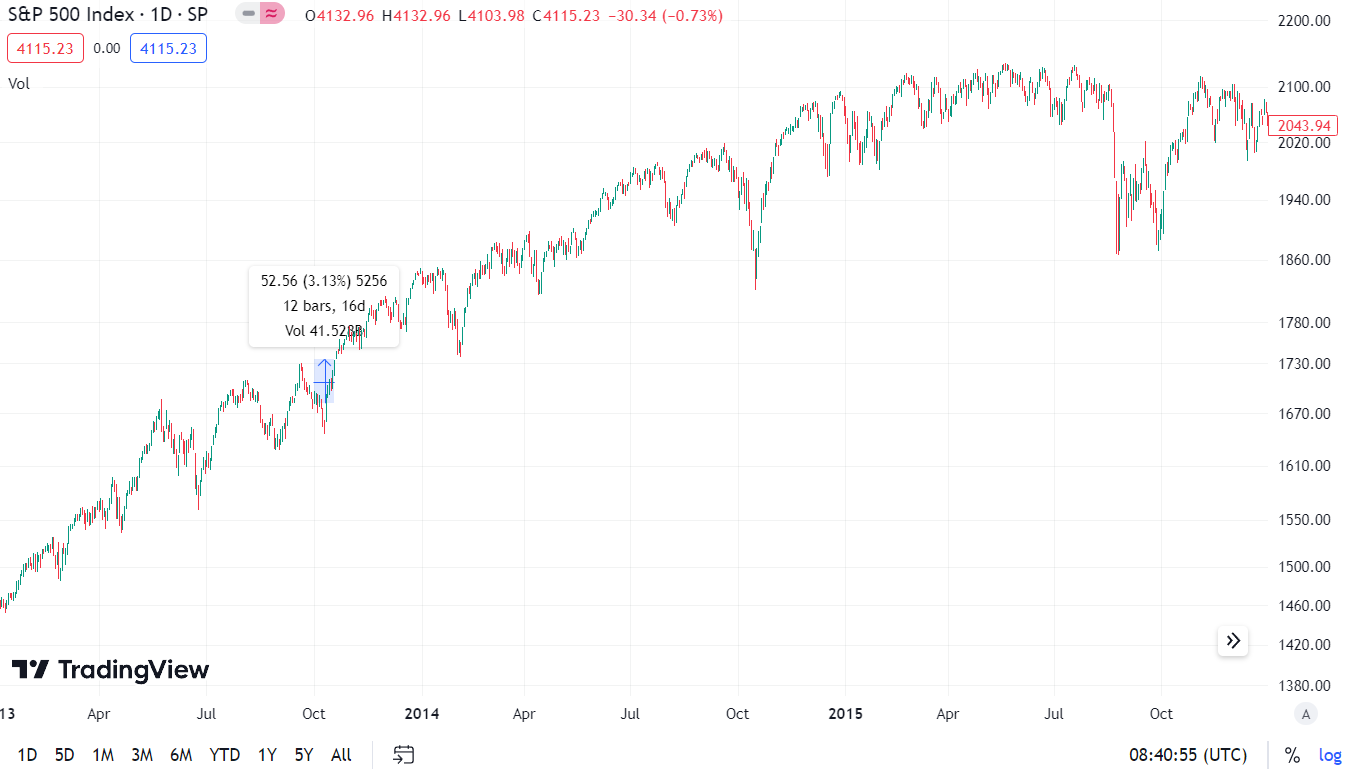
How was he doing S&P 500 index in the period under review? Well, he took it easy again. Between October 1 and October 17, the S&P 500 index increased by more than 50 points (ie by 3%). It is worth noting, however, that investors were slightly nervous during the government's lockdown. As a result, at the session on October 8, the market fell by 1,2%. The day before, the declines amounted to 0,85%.
If we look at the chart from 2013 to 2015, it will also be hard to find one of the longest Government Shutdowns in history. A person would sooner indicate the declines from the summer of 2015 on the chart. Back then, the panic was caused by the collapse of the Chinese stock market, not US debt.
Can 2018/2019
Overall, this is the worst market behavior during a political dispute and the best market reaction during Government Shutdown. What was the basis of the political conflict? Huge dispute between Democrats and President Donald Trump's entourage, which resulted in no budget compromise being announced. The bone of contention was the wall on the border with Mexico. It was one of Trump's election promises. For Democrats, a stupid project that unnecessarily inflamed the situation between the US and Mexico. The deadlock caused 800 workers to go on leave. The dispute lasted 35 days and ended with a compromise.
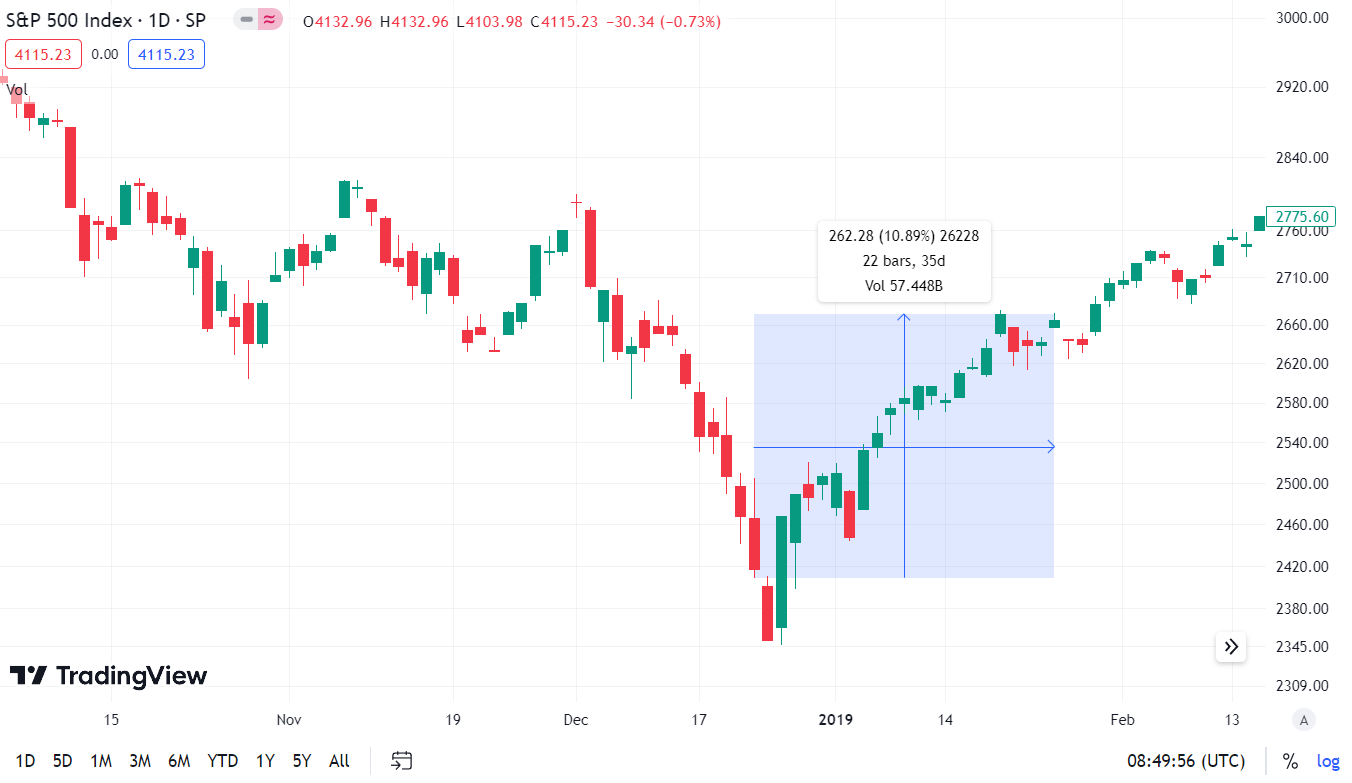
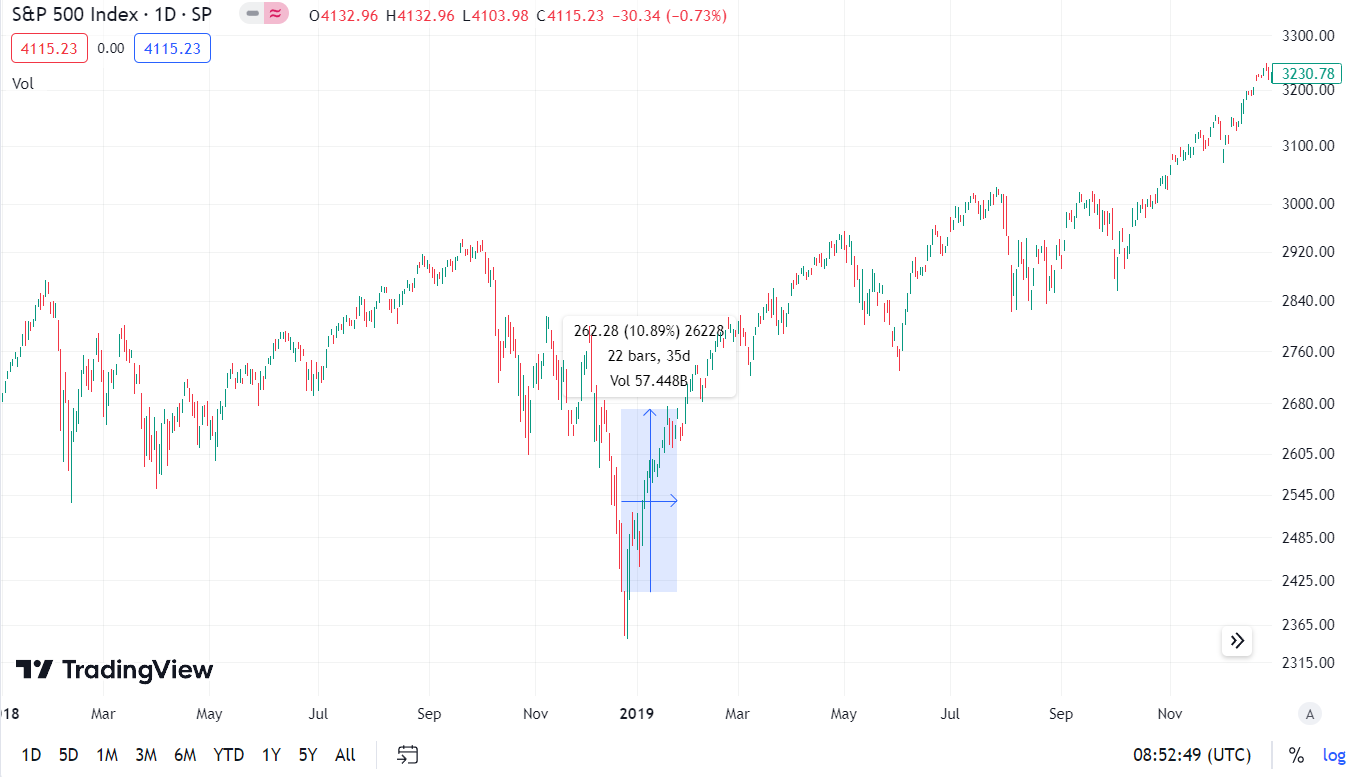
During the political dispute, the stock market reacted nervously. As a result, the market was falling before the decision to announce a "government shutdown". The sell-off was really violent. Between December 3 and December 21, the index fell from 2 points to 790 points. This represented a decrease of 2%. After a small panic on December 416, 13,4, there was an upward rebound. Between the close of December 24, 2018 and January 21, the index increased by less than 2018%. The peak of December 25 was surpassed on February 11, 3. Moreover, on May 22, 2019, the S&P 1 index reached the level of 2019 points. This meant that the peaks of August and October 500 were overcome. The following months brought a continuation of the bull market on the American market. It was only interrupted by COVID-2.
2011 case: debt limit, rating downgrade. How did the S&P 500 react?
We know how the US stock market fared during the three biggest US government shutdowns since the fall of the Berlin Wall. However, a very interesting situation took place in 2011. Then there was a political dispute over raising the debt ceiling.
At that time, the Western world was struggling with a debt crisis and weak banks. The US and the EU were just licking their wounds after the real estate crisis. Moreover, the euro was shaken in its foundations due to the problems of the PIIGS countries. Many commentators believed that too much debt would weigh heavily on economies for years to come. Because of this, there was a big problem regarding the new debt limit.
In mid-2011, the market began to fear that the debt limit would not be raised. Deadline was set for August 2, 2011. Both Democrats and Republicans accused each other of not wanting to compromise. When it seemed that the shutdown was already certain, on August 2 an agreement was reached. The debt limit has been raised by over $2 trillion. The limit was effectively supposed to be raised from January 2012. However, in order for the government to function, Congress agreed to issue $400 billion of debt starting August 2 and raise an additional $500 billion for further spending if Congress agrees.
The dispute over the debt limit has been resolved, but another blow has appeared. S&P downgraded the US credit rating from AAA to AA+. It was a blow to the image of the United States. S&P feared that the US was unable to return to a low-debt path. According to the agency, the compromise of August 2, 201 did not promise a significant reduction in the deficit.
How has the market reacted to such a market environment? In the short term, it was quite weak, but in the long term it returned to growth.
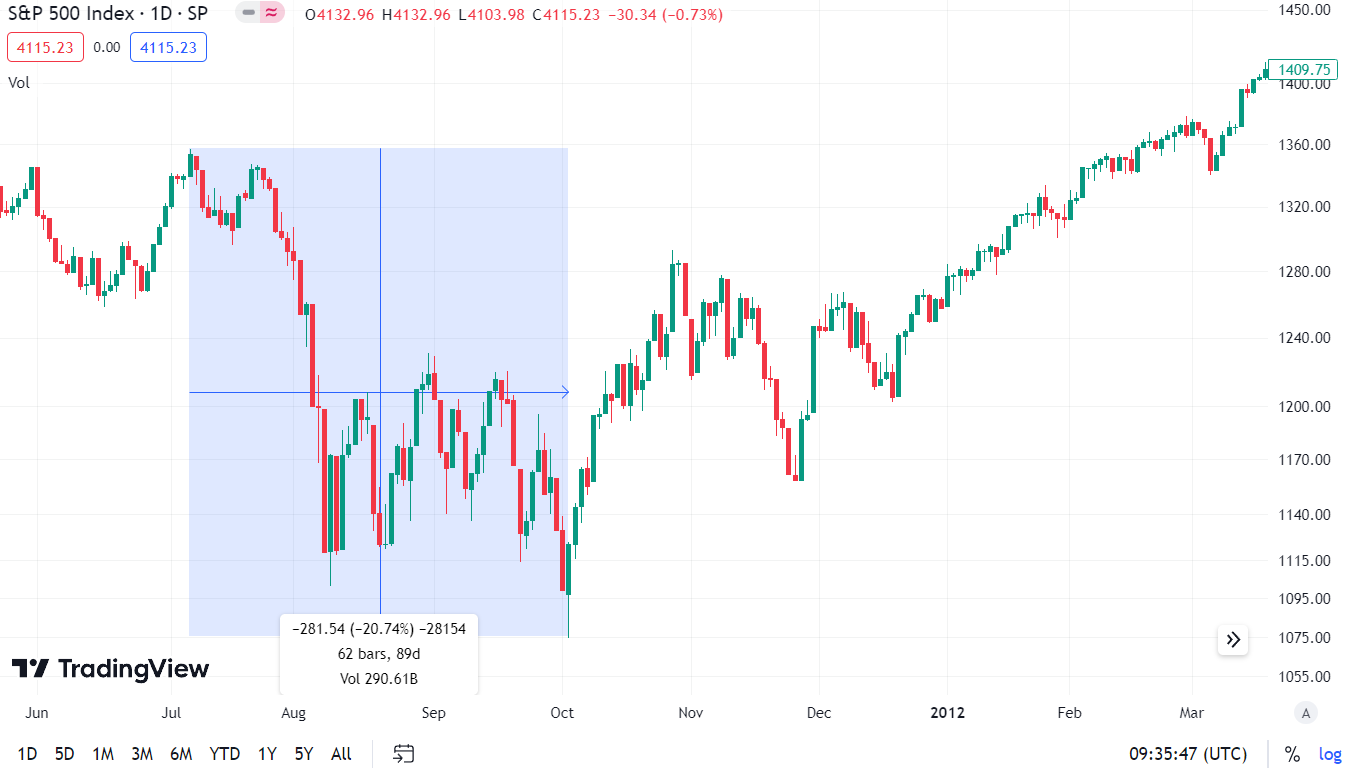
The correction in the S&P 500 market between July 7, 2011 and October 4, 2011 is marked in blue. The declines amounted to over 20%, counting from the peak to the maximum of the trough. However, the long-term investor should use the declines to accumulate overvalued stocks. Already at the end of February 2012, the S&P 500 was above the high of July 2011.
Summary: If you're afraid of going down, think about hedging your positions
In the article, we brought the history of the American debt limit closer. On real market examples, we learned how the market reacted to the longest Government Shutdown in history. The conclusions are obvious: for the long-term investor, a market panic is stock accumulation time. In each of the examples given, the stock market was higher after a year than when the market began to worry about the debt limit or the closure of some federal agencies.
Even if after reading this article you are still concerned about the value of your portfolio in the coming months, consider hedging your positions. Acquisition put option or taking a short position on indices may constitute “Black Swan insurance”. However, hedging is costly if a bad scenario doesn't materialize. Therefore, it is worth thinking carefully about what is the most appropriate strategy for us. Highlights: NO PANIC. Debt limit political crises are likely to recur in the future.


![Forex Club – Tax 9 – Settle tax on a foreign broker [Download the Application] Forex Club - Tax 9](https://forexclub.pl/wp-content/uploads/2024/02/Forex-Club-Podatek-9-184x120.jpg?v=1709046278)
![Trading View platform – solutions tailored to the needs of traders [Review] trading view review](https://forexclub.pl/wp-content/uploads/2024/03/trading-view-recenzja-184x120.jpg?v=1709558918)
![How to connect your FP Markets account to the Trading View platform [Guide] fp markets trading view](https://forexclub.pl/wp-content/uploads/2024/02/fp-markets-trading-view-184x120.jpg?v=1708677291)
![How to invest in ChatGPT and AI? Stocks and ETFs [Guide] how to invest in chatgpt and artificial intelligence](https://forexclub.pl/wp-content/uploads/2023/02/jak-inwestowac-w-chatgpt-i-sztuczna-inteligencje-184x120.jpg?v=1676364263)


![WeWork – the anatomy of the collapse of a company valued at $47 billion [WeWork, part II] wework bankruptcy story](https://forexclub.pl/wp-content/uploads/2024/04/wework-bankructwo-historia-184x120.jpg?v=1711729561)
![Adam Neumann – the man who screwed up Softbank [WeWork, part AND] adam neumann wework](https://forexclub.pl/wp-content/uploads/2024/04/adam-neumann-wework-184x120.jpg?v=1711728724)


![How to transfer shares to another brokerage office [Procedure description] how to transfer shares to another brokerage house](https://forexclub.pl/wp-content/uploads/2024/03/jak-przeniesc-akcje-do-innego-biura-maklerskiego-184x120.jpg?v=1709556924)

![The most common mistakes of a beginner trader - Mr Yogi [VIDEO] Scalping - The most common mistakes of a beginner trader - VIDEO](https://forexclub.pl/wp-content/uploads/2024/03/Scalping-Najczestsze-bledy-poczatkujacego-tradera-VIDEO-184x120.jpg?v=1711601376)
![Learning patience: No position is also a position - Mr Yogi [VIDEO] Scalping - Learning patience - No position is also a position - VIDEO](https://forexclub.pl/wp-content/uploads/2024/03/Scalping-Nauka-cierpliwosci-Brak-pozycji-to-tez-pozycja-VIDEO-184x120.jpg?v=1710999249)
![When to exit a position and how to minimize losses - Mr Yogi [VIDEO] Scalping - When to exit a position and how to minimize losses - VIDEO](https://forexclub.pl/wp-content/uploads/2024/03/Scalping-Kiedy-wyjsc-z-pozycji-i-jak-minimalizowac-straty-VIDEO-184x120.jpg?v=1710336731)


