


What is the Citi Economic Surprise Index (CESI)?
?")
There are many indices in the world, and undoubtedly the most famous are stock indices. The leading companies in this market are: S&P Global and Msci. Both are listed on the stock exchange. Of course, there are many types of indexes. Some of them perform more a marketing function than they bring any value. We're going to take it to the workshop today Citi Economic Surprise Index (CESI). For many readers, the index probably means nothing. Therefore, we will briefly summarize what the mentioned index is and what are its advantages and disadvantages.
What is City Economic Surprise Index?
It is an index developed by Citigroup i it is calculated on the basis of differences between economists' forecasts and official macroeconomic data. The Citi Economic Surprise Index is compiled on the basis of macroeconomic data from various regions. Calculations can be found for the United States, but also for areas of the European Union, as well as Asia.
Index indications are simple. If the macroeconomic data were better than investors' expectations, the index has a value higher than 0. If the actual data were worse than analysts' expectations, the Citi Economic Surprise Index has a negative value.
The index is sensitive to analysts' expectations. If they are pessimistic and the market surprises positively, it may mean that the market is too skeptical about the economic outlook. If analysts' expectations are too optimistic, the indicator will have a negative value.
Some people follow the trend of the CESI index. An upward trend means that the economy is doing better than expected by the market. On the other hand, a downward trend may be a harbinger that a change in the economic cycle is imminent.
Advantages of the indicator
The index can be a synthetic measure of how the market perceived the macroeconomic environment in the past. Thus, it allows to measure the mood among analysts. Some may use the index as an opportunity to go long in an overvalued market. This was in the spring of 2020. Then the market took analysts by surprise. As a result, there was an extremely low indicator reading. Another example is 2008 when CESI also recorded very low values. As it turned out later, it was a good time to accumulate overvalued stocks.
The big advantage is its simplicity. Thanks to this, the investor can quickly analyze the relationship between macroeconomic data and market expectations. The greater the difference, the more likely we are approaching an important turning point (economic or change in analysts' views).
In the short term, the market usually rises after better-than-expected macroeconomic readings. CESI can therefore be a useful tool in the hands of a short-term investor.
Defects of the indicator
One of the biggest drawbacks of the indicator is that it only focuses on what has happened in the past. It does not predict the state of the economy for the coming years.
Another disadvantage is the high volatility of this indicator. For this reason, it can generate a lot of false signals about a turning point in the economy of a given country or region.
It is not an indicator describing the economic situation of the country. It only checks whether the market beat the expectations of analysts and investors. For example, if the market expected GDP to grow by 4% y/y and the economy grew by 3,9%, the index is reduced. If, on the other hand, the market expected a decline in GDP by 3%, and the decline was 2,8%, then the value of the indicator increases.
The index is not suitable for long-term investors. This is because what counts in the long term is the company's business model and its ability to generate profits and free cash flow (FCF). The current economic situation has a negligible impact on the value of profits, revenues and FCF in 10 or 15 years.
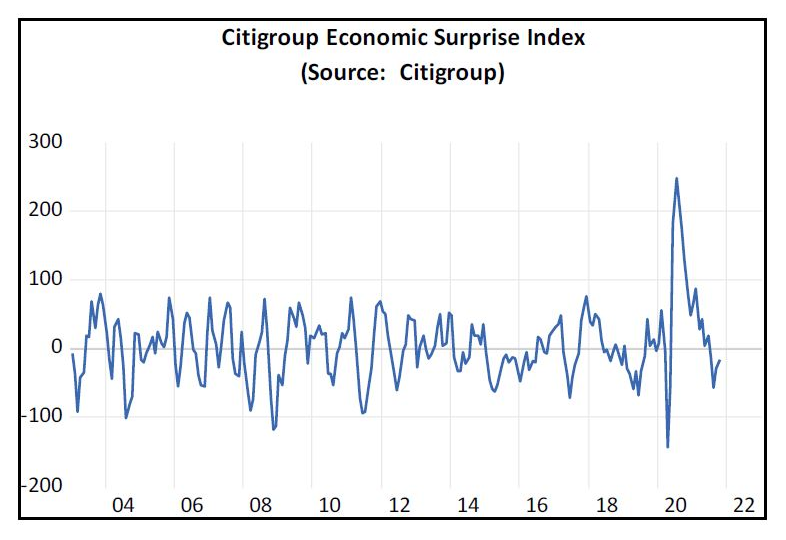
Citigroup Economic Surprise Index. Source: etftrends.com
Summation
CESI is an indicator that is little known to investors. It's not a perfect index. In simple terms, it is a comparison of market expectations regarding specific macroeconomic data (e.g. unemployment, economic growth) with their actual indications.
The number of macroeconomic data taken into account when calculating the CESI is very large. The range of indicators is very large. From the most known measures like change CBA or unemployment to “niche” indicators such as orders for durable goods. Other niche indicators are e.g. Cass Freight Index Shipments. This is a measure that measures the number of intra-continental freight in North America.


?")
?")


