


COT Trading - how to read the signals flowing from the Commitments of Traders report

Commitments of Traders (COT) report published by the US CFTC (US Commodity Future Trading Commission). It is the only report that allows us to see how the biggest speculators in the regulated futures market in the United States are trading. This report presents open long and short positions of given entities, which are responsible for 70-90 percent of all open positions in the futures market. The COT report has been published since 2000 in weekly intervals on Fridays, and the transactions presented in it concern the closing of the session on Tuesday. However, the first introduction of reporting took place in 1924.

Publication calendar for 2018 with the shift due to federal holidays. Source: CFTC.gov
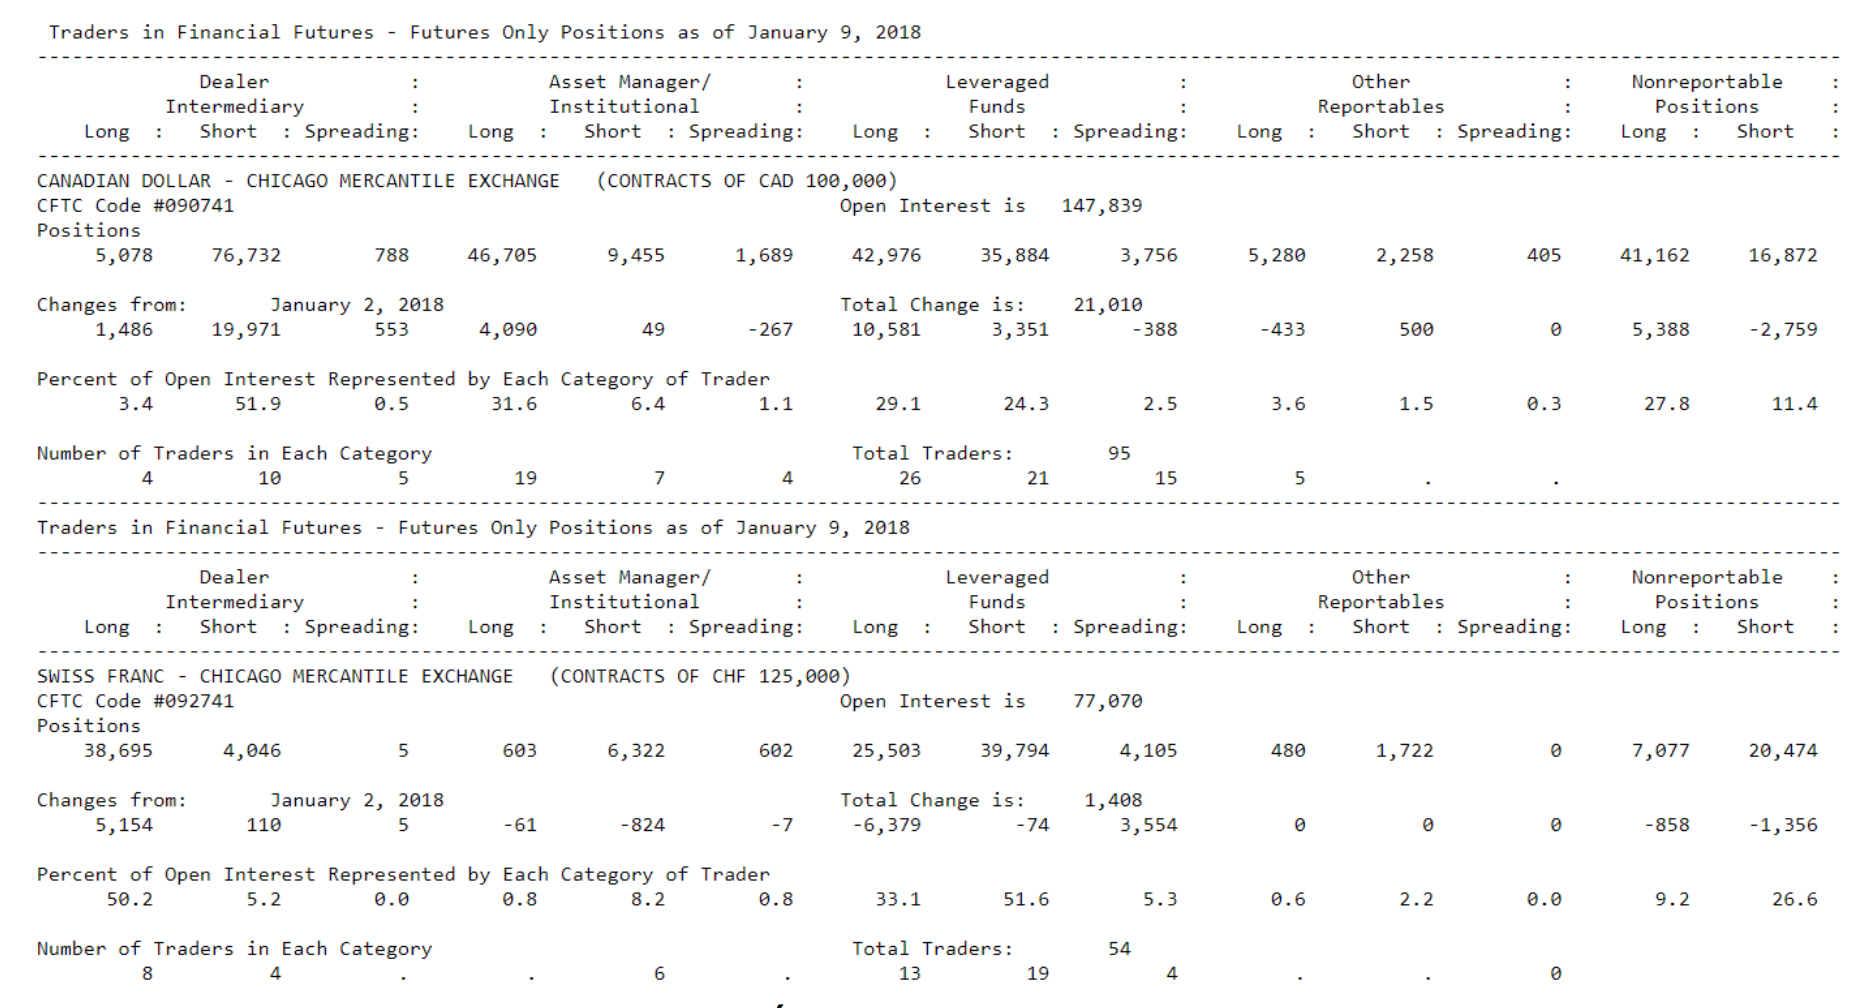
Sample publication of a COT report. Source: CFTC.gov
From the above list, if someone wants to, they can choose the right data themselves and create their own chart in the spreadsheet for positioning large players or they can use ready-made widgets available on the Internet.
The most popular and most readable sources for this report are the following websites:
- http://www.cmegroup.com/tools-information/quikstrike/commitment-of-traders-agricultural.html
- https://www.dukascopy.com/swiss/english/marketwatch/COT/
- https://finviz.com/futures
Now that we know where to find the data flowing from the report, let's see what potential medium and long-term signals from it look like. It must be remembered that we are talking about data shown once a week and the approach to the market of institutions that do not change their minds several times a day like retail players. So, we often talk about the approach even a few months ahead.
Divergences - price and positioning
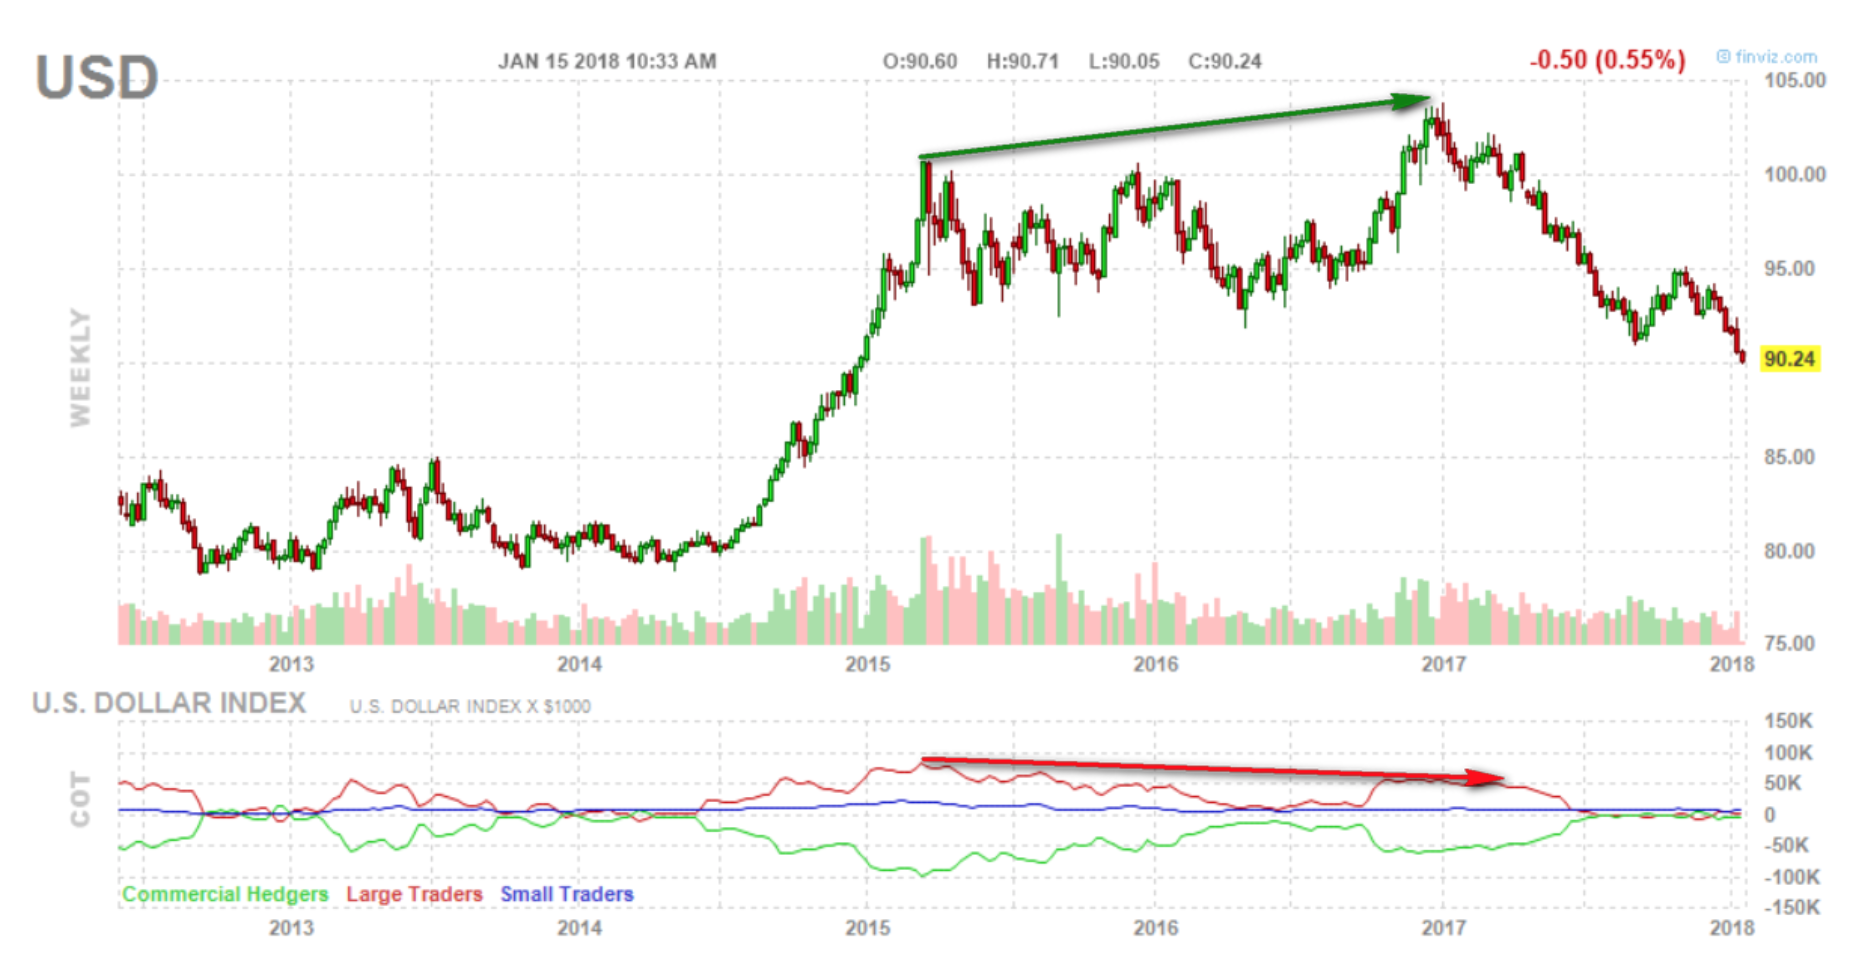
Probably the simplest layout to observe, because it is well known for classic technical analysis indicators. Only here we do not have MACD, RSI or other oscillator, and the money from which someone has bought a contract for an increase or decrease. So if the price increases, but the increase does not increase the involvement in long positions, it means that the price is not very attractive and the market may be ready to change the trend or even the correction.

There is also a second type of divergence in which price does not create a new extreme. In the above example of a new low, speculators are even more involved in down positions. This means that they put a lot of money into a scenario that does not materialize because price does not create a new low. When they realize that all their efforts and money have been wasted, a strong opposite trend usually begins.
Extreme buy / sell out
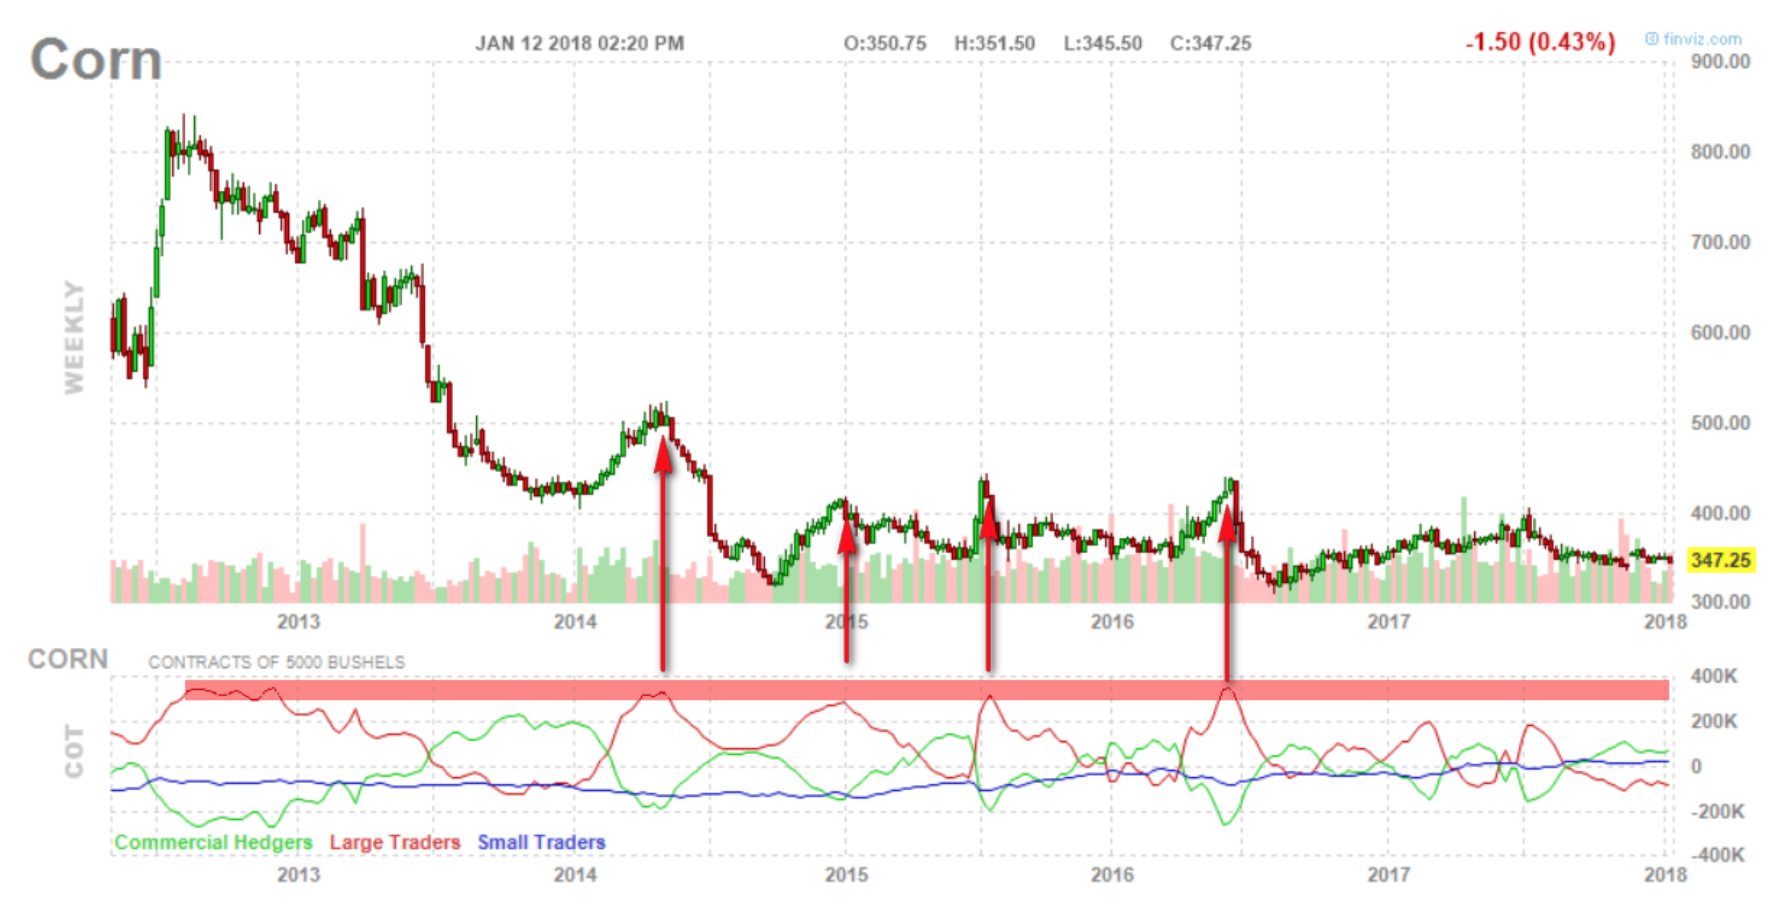
It happens that in a given market the same amount of money appears for a given year and hence the chart of engagement in the position takes the form of an oscillator at a given level of buying / selling the market. Then it may mean a turning point unless there are even more new items at this moment that will negate the several-year-long scheme.
The two above schemes are simple ways to start looking for return places in the markets or the potential for its occurrence. However, the simplest interpretation is buying when buying funds and selling, when they play for a short time, the problem only in that they too are wrong.


