


Advanced Trading Tools - advanced tools from IC Markets

IC Markets, a new partner of Forex Club, has prepared a set of 21 tools to support trading (the so-called trading tools). Collection in the form of indicators and automata (Expert Advisor) is intended for use on MetaTrader 4 and MetaTrader 5. The files are available in the installation form, so you don't have to copy them to the appropriate folders on the platform, and they often even have a Polish-language interface.
In this article, we will show you what exactly you will find in the collection "Advanced Trading Tools" from IC Markets.
Advanced Trading Tools
Mini Terminal
 A small combine harvester to place transactions on the chart. This is more developed One Click Trading, which is already available as standard on MT4. Thanks to it, we can actually forget about the Terminal window and occasionally look there only to view our account balance.
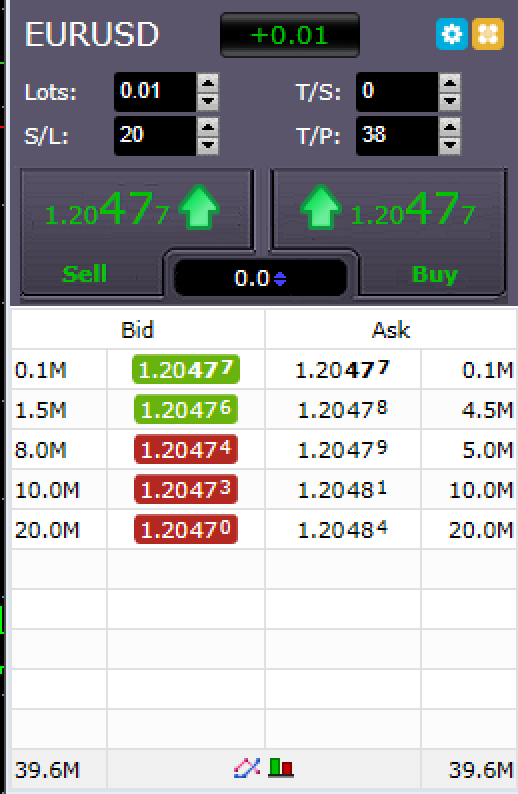
The Mini Terminal allows us to conclude transactions with the setup with one click Stop Loss, Take Profit and Trailing Stop. But it doesn't stop there. With one click (or rather two, because you have to go to the second tab) we can close all positions, recently opened, only gaining or only losing. It is also possible to reverse the direction of the trade (close and open the opposite one) or hedge it. There is also an option to set pending orders and save our favorite templates with parameters.
It's still not all :-). The Mini Terminal can be attached to the graph, or completely detached from the platform. It was also equipped with a small tick chart and market depth (within the IC Markets' liquidity). From the level of DoM, you can add pending orders Buy / Sell Limit with ready parameters SL, TP with one click.
Summary at a glance? A great tool for a trader that will satisfy the needs of the vast majority in 100%. You could work on a bit of a look, but it's just gripping something.
Correlation Trader
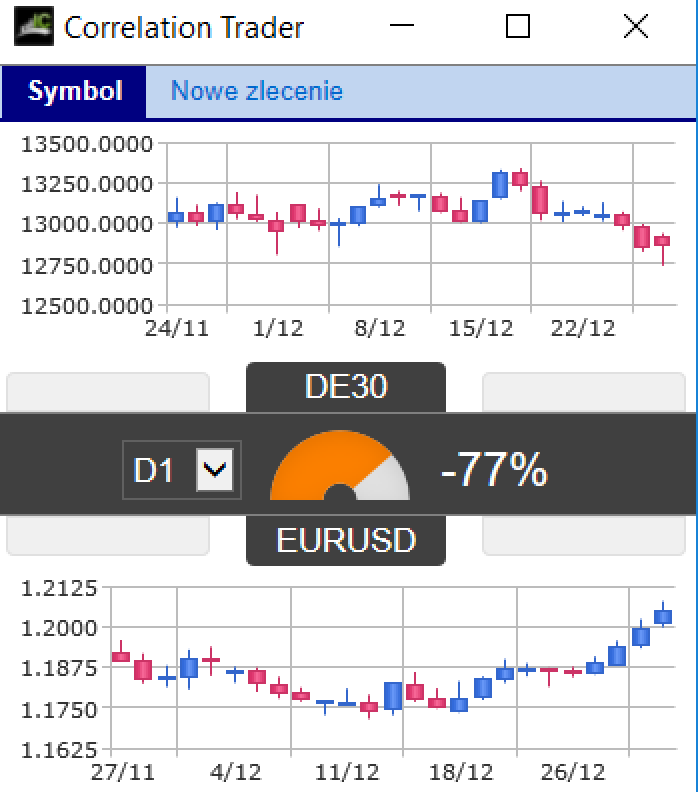 Overlay used to test correlations. This is an additional window available on the chart that displays two additional mini-charts and measures the correlation ratio between the selected instruments. There are as many as 19 time intervals, including quite unusual such as M6, M10, H12. However, the downside is that the maximum scale is D1, ie the lack of weekly and monthly candles.
The tool also allows you to enter orders, although in my opinion this is unnecessary. It is much more practical and convenient to use the Mini Terminal and support Correlation Trader in a separate window.
Correlation Matrix
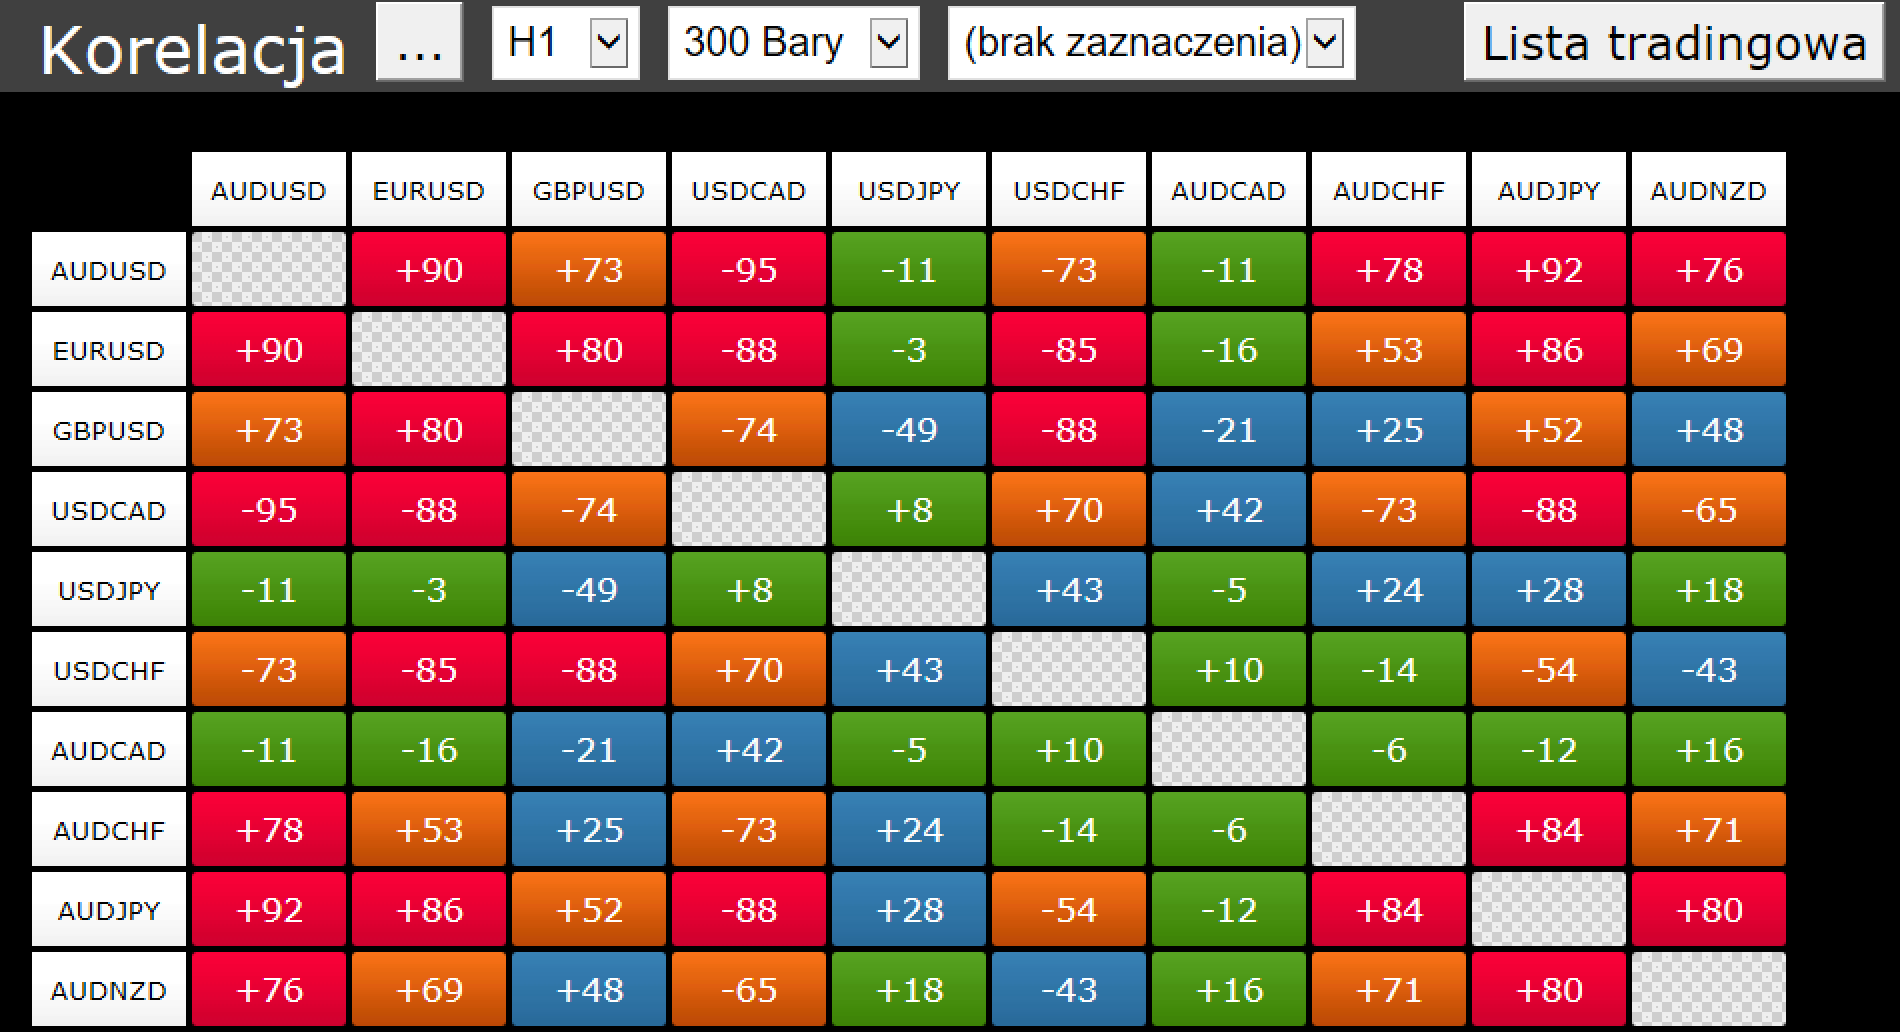
A more interesting and more powerful tool for measuring correlation. EA, which creates a whole table in a separate window with dependencies between selected instruments. Only the most popular intervals of 8 are available, but for most traders it will be enough. The correlation can be examined based on from 25 to even 1000 bars from the selected TF. It must be admitted, however, that the choice of more posts considerably affects the speed of the platform.
From a large amount of data and colors you can get a small nystagmus but with the help of the option of filtering according to the significance of correlation (eg strong, weak, missing, etc.).
Tick Chart Trader
Something that the MetaTrader 4 platform is missing for a long time. Tool with a tick chart in a separate window (on the chart). On the downside - only currency pairs are available for viewing. We can choose to display data due to: tick, tick speed, time, candles, seconds, relative to another pair (versus). Additionally, the tick chart can be stopped and the data saved to a separate csv file.
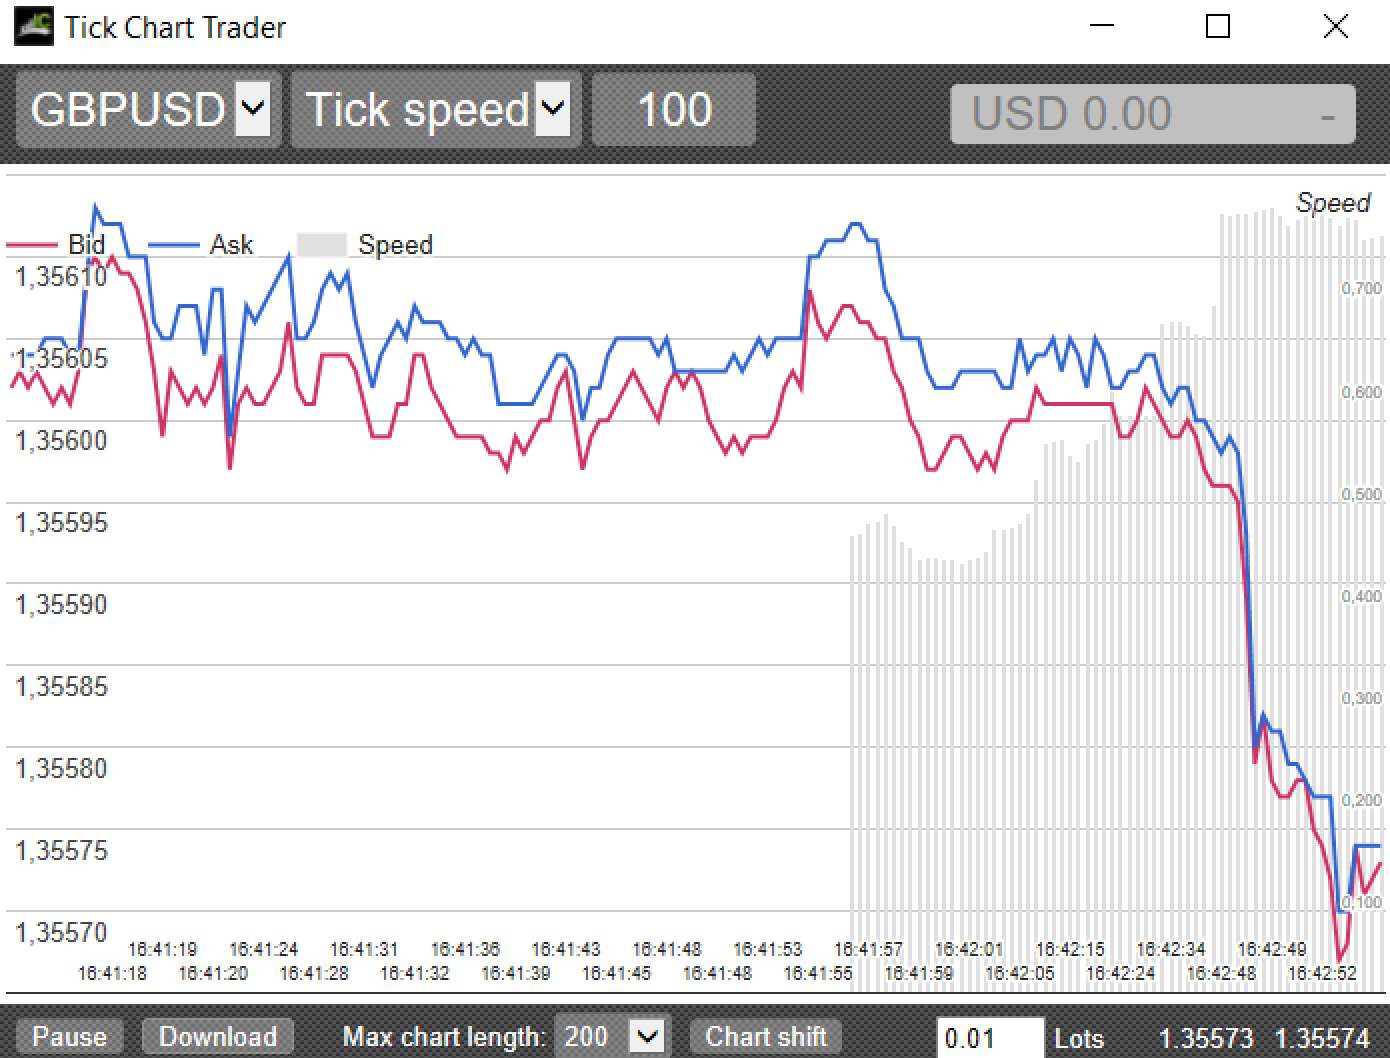
Tick Chart on MT4, Advanced Trading Tools.
Other tools
- Alarm Manager - a tool for managing alerts on the platform. Notifications from as many as 6 categories are available: price alarms, bill alarms, trading alarms, alarm time, news alarms, technical indicators.
- Connect - a separate "chart" window with a news stream from the world of finance (only in English).
- Market Manager - instrument list management tool. We can quickly display instruments detailing, for example, only those with USD or CHF in a pair. Additional information is the accumulated number of lots and the current profit / loss on a given currency pair.
- Tick Chart Trader - tick chart in a separate window. Lots of additional configuration options.
- Trade Terminal - an additional window (replacing the chart window), in which the modules known from the Mini Terminal are displayed collectively for various instruments. The tool is extended with an additional "terminal" with a list of orders.
- Stealth Orders - EA to set "hidden" pending orders.
- Session Map - a tool showing the times of stock exchange sessions on the world map.
- Sentiment Trader - a simple slot machine that shows the market sentiment on an ongoing basis based on ICM clients' orders. Additionally, it is equipped with the possibility of concluding transactions.
indicators
Candle Countdown
A simple indicator for counting down the time to the end of the candle. Simple to build, but well thought out. It refreshes independently of the tics flowing onto the platform (timer function) and can be configured freely (colors, location, font). In addition, it is equipped with an alarm that will notify us about X seconds before closing the candle.
Freehand Drawing
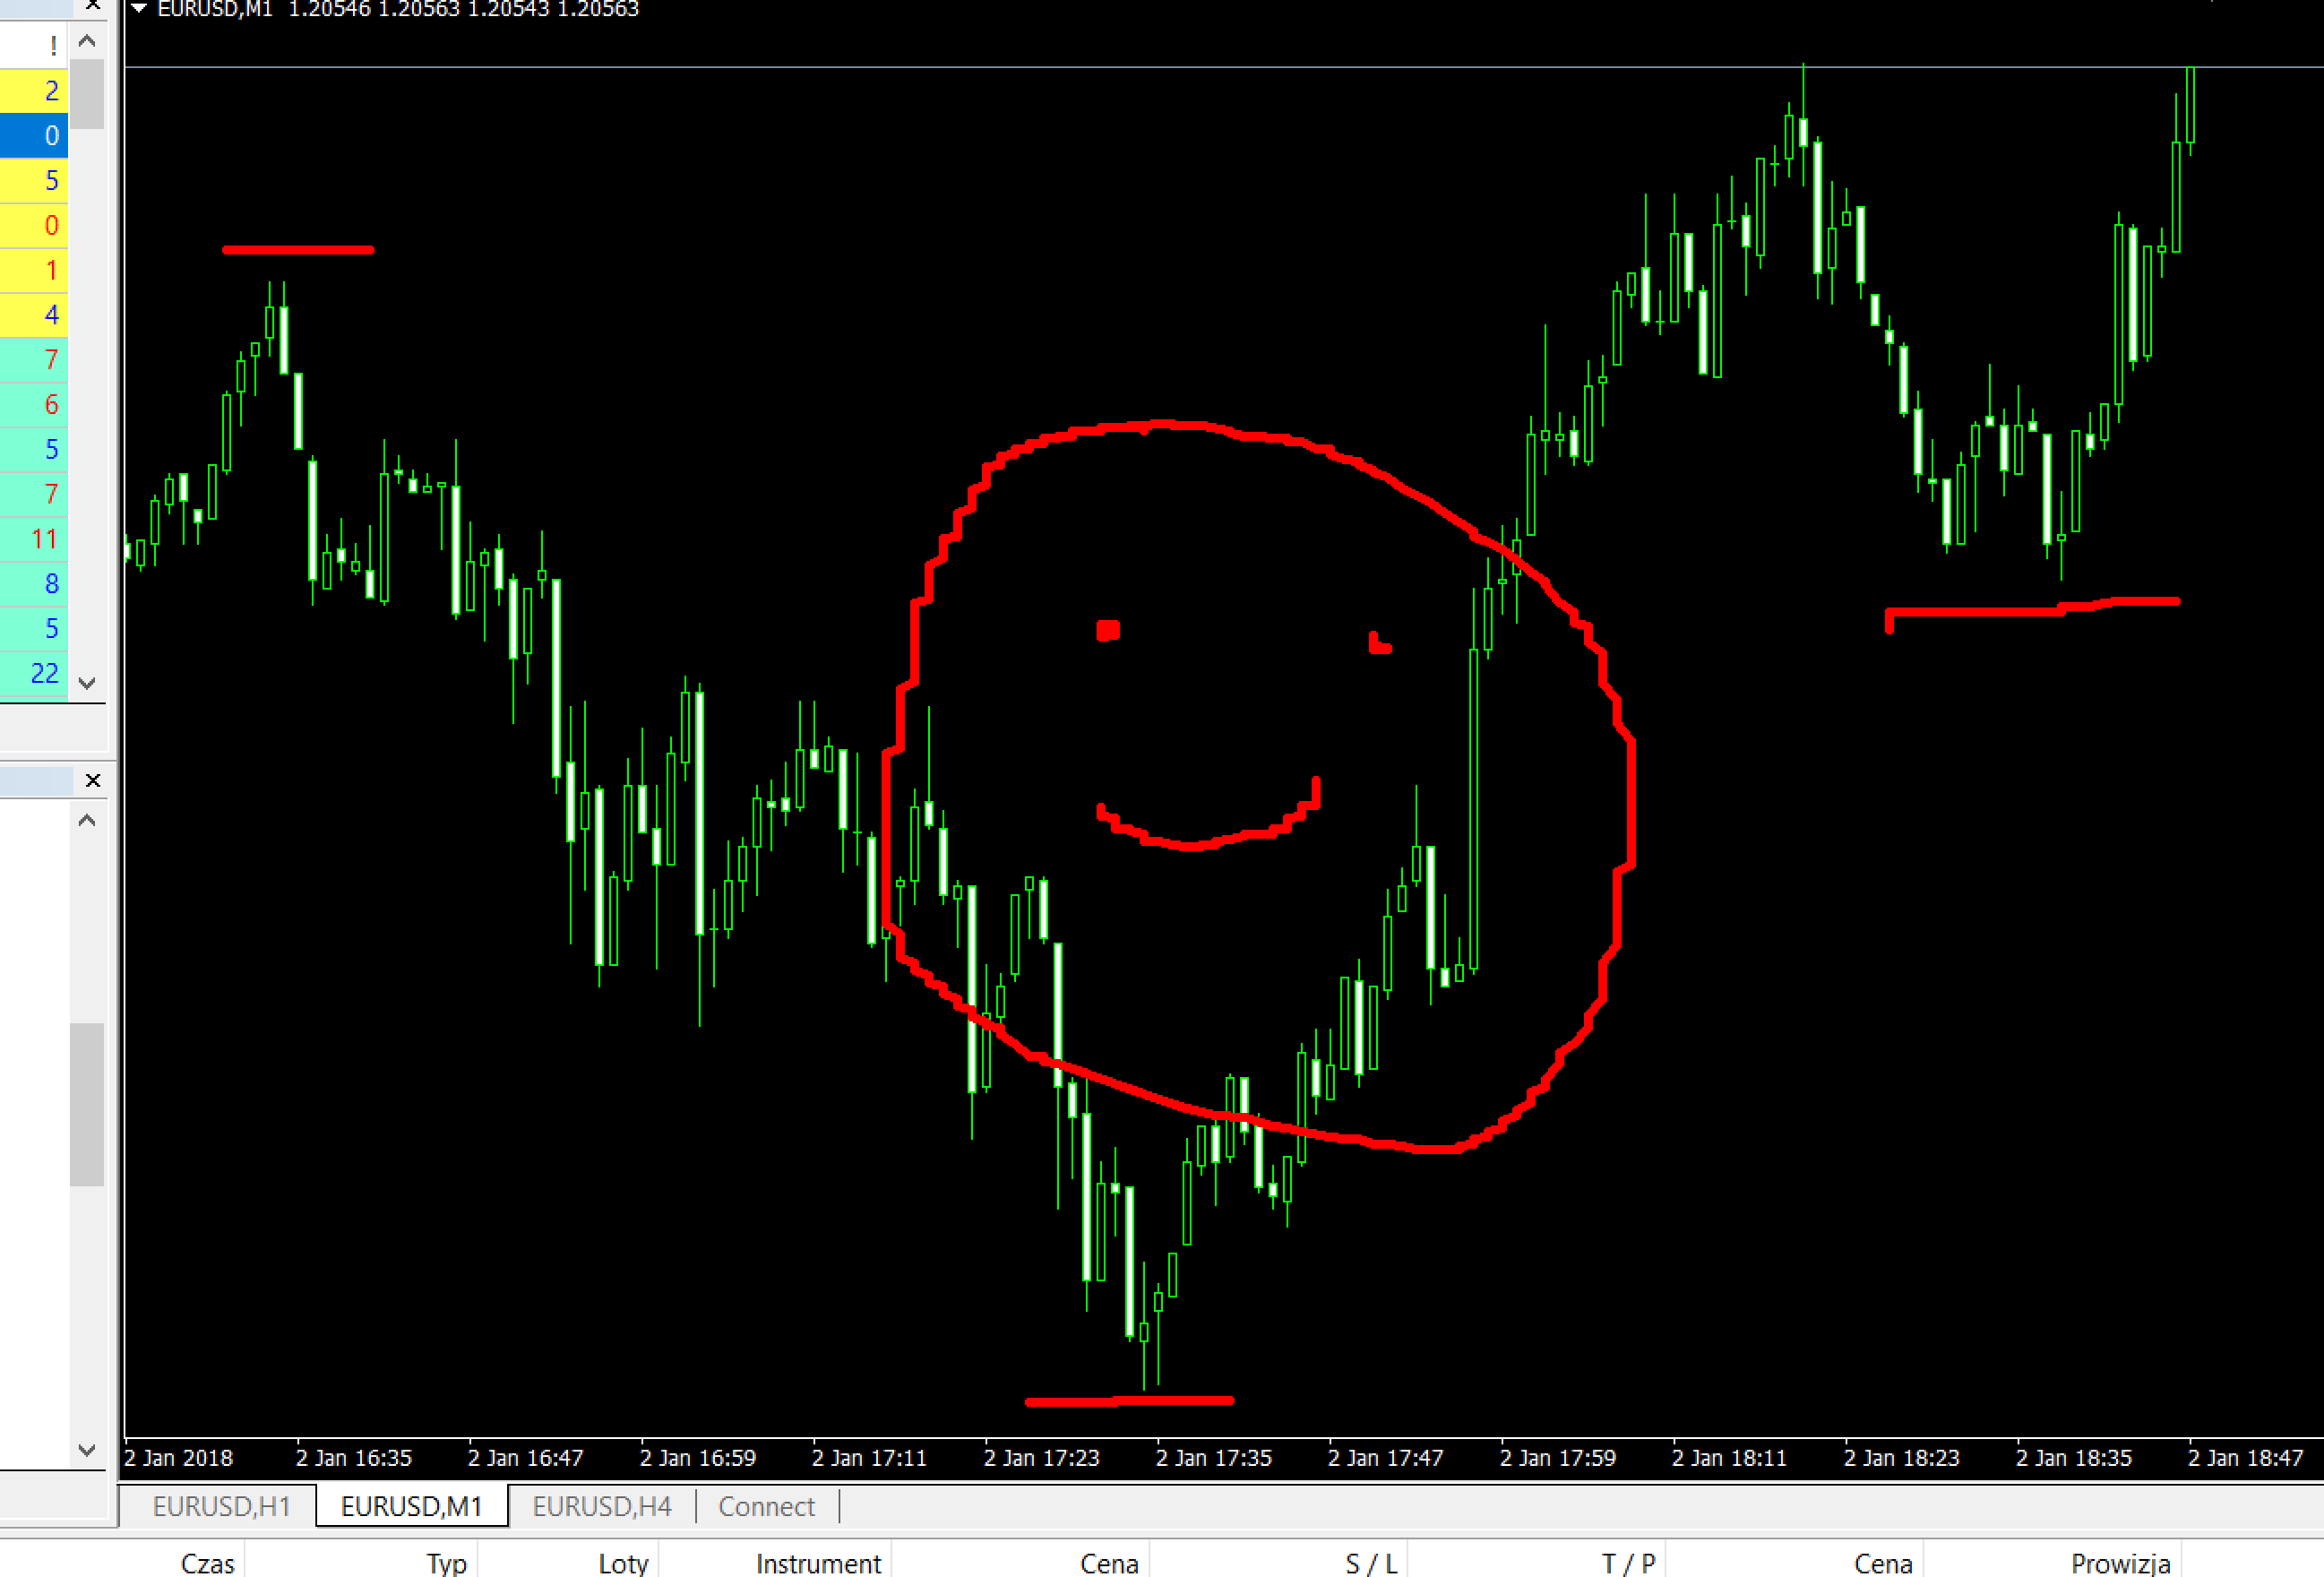
A brilliant tool for drawing on a graph. It is enough to hold "D" on the keyboard and move the cursor so that our platform gets the possibilities straight from Windows Paint. One button is also used to change the color or undo the last drawn object.
The only downside is the lack of any legend on the chart so it will take us a moment to remember all the keyboard shortcuts. We can also change the shortcuts on your own, but if you happen to forget your own settings, the only way to suspect them is to re-enter the parameter settings.
High-Low
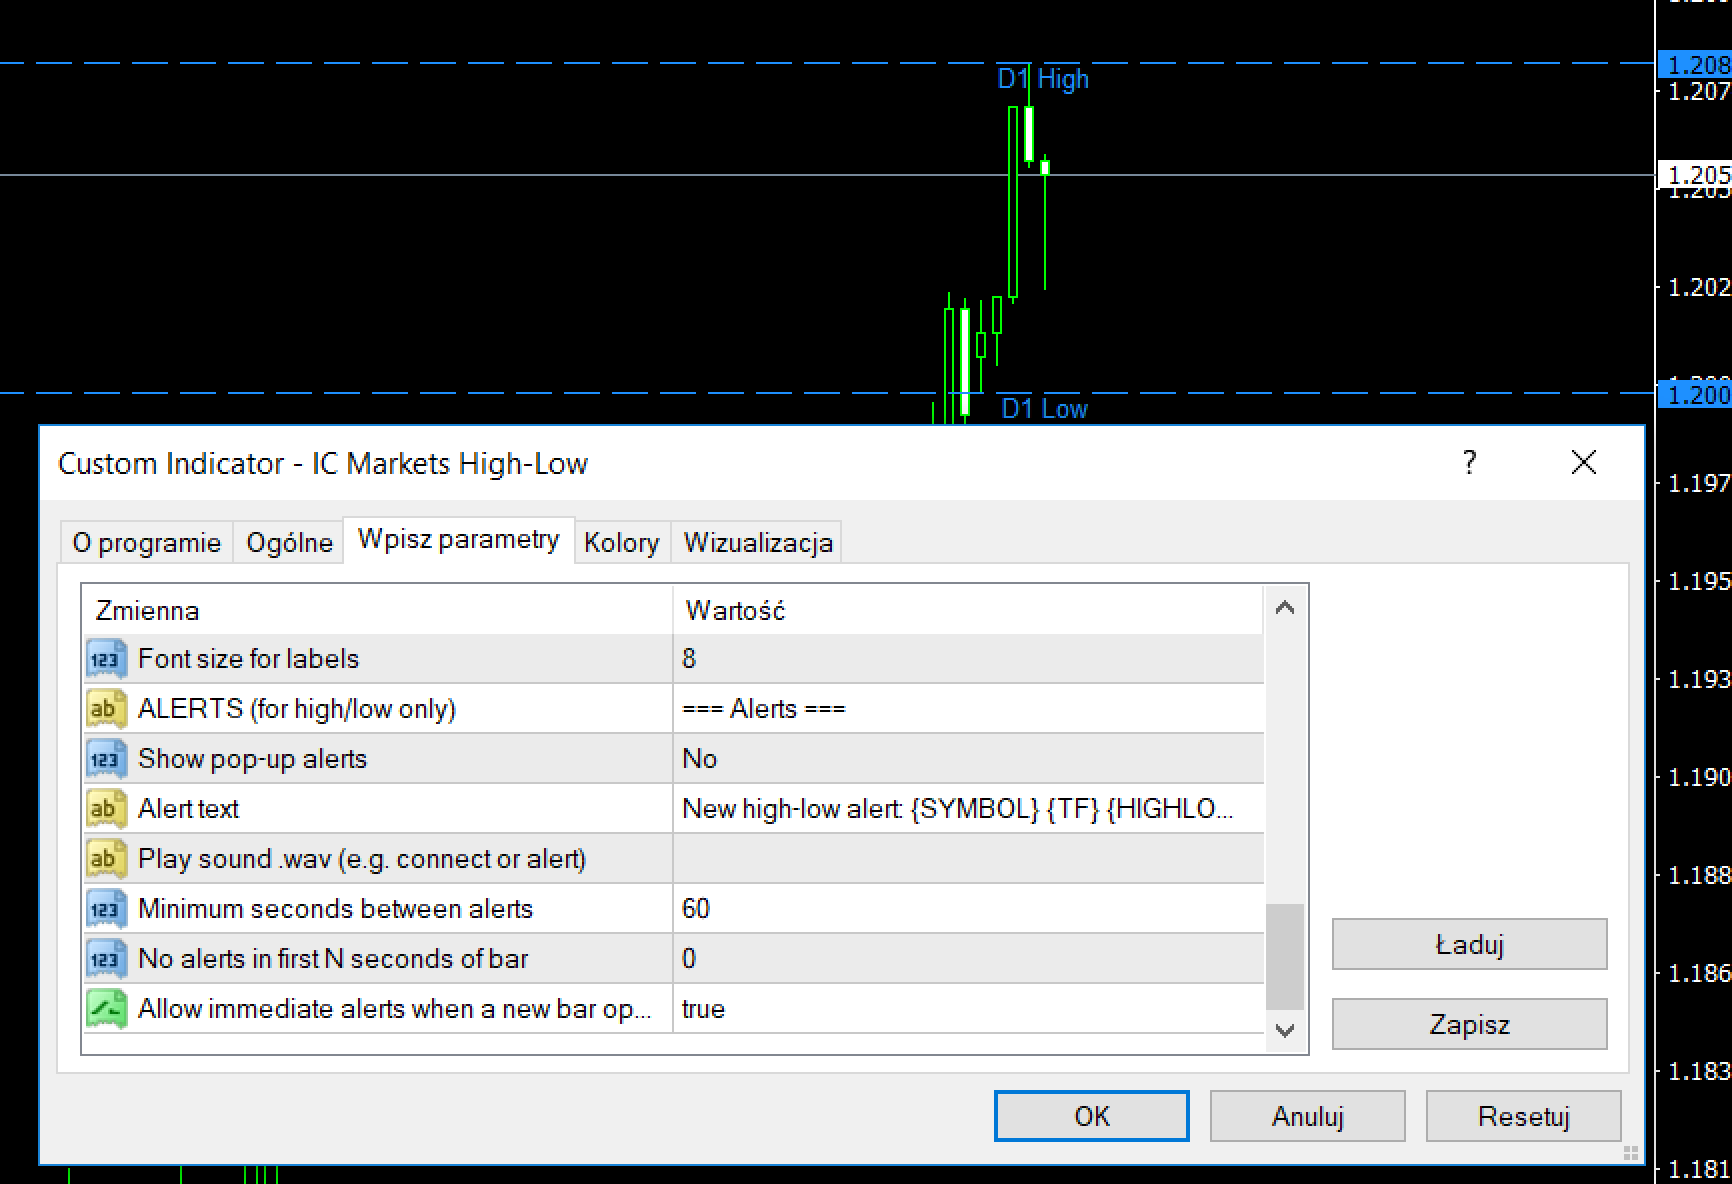
Indicator designating the local peak and dimple. A simple but useful tool rich in additional options. H / L can be determined based on the interval and its range entered in the options, eg from the last 5 daylight candles.
There are many configuration options (such as appearance, range, etc.), as well as the option of adding notifications in the form of alarms.
Order History
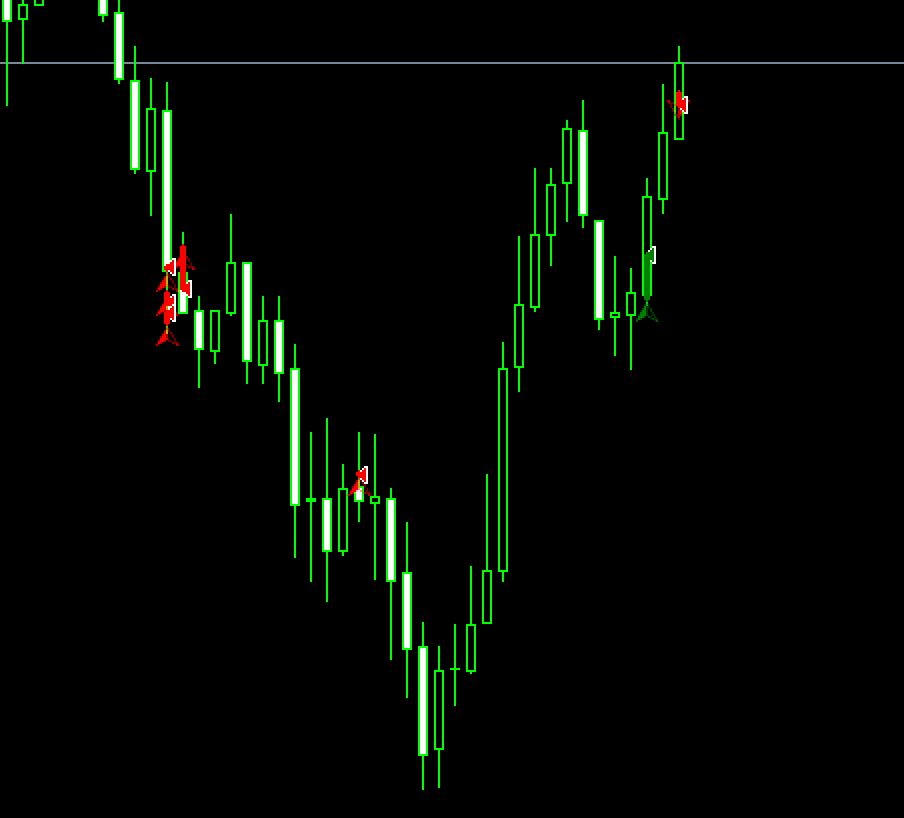
A tool that automatically marks the place of the transactions we conclude on the chart. The MT itself has such a feature built into the standard, but in order for the closed positions to be marked, each time you have to enter the story and transfer them to the graph. Here everything happens immediately.
Of course, there are also a lot of configuration options, such as the appearance of objects, the scope of history covered, etc., so that we can adjust the indicator to suit your needs and the chart template we use.
Other indicators
- Pivot - pivot points superimposed on the graph. Basic configuration options + alerts.
- Chart-in-chart - the ability to add a second chart in the same window (the chart of the additional instrument is included in the indicator window part).
- Renko - places rectangles on the candles on the Renko chart shape.
- Chart Group - a tool for grouping charts using the markings entered by us.


